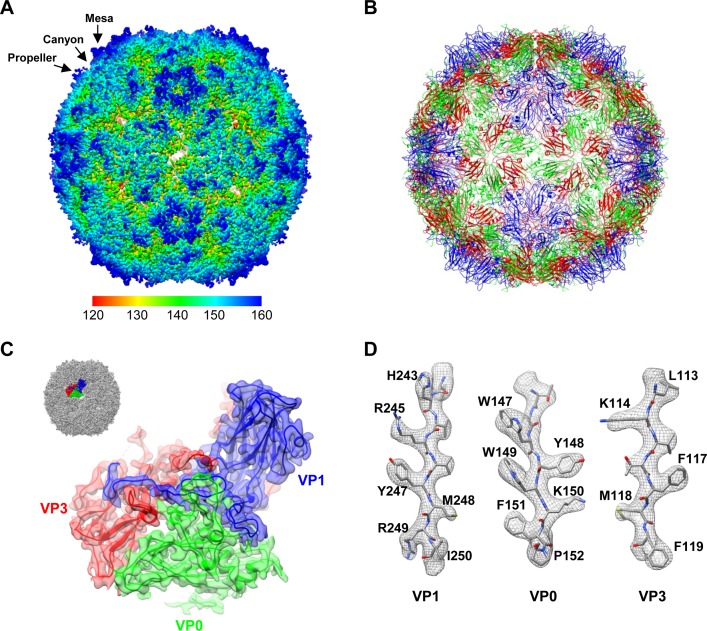
FIG 2.
Overall structure of the CVA6 VLP. (A) Cryo-EM density map of the CVA6 VLP viewed along the icosahedral 2-fold symmetry axis. The map is colored radially. The color bar labels the corresponding radius from the center of the sphere (in angstroms). The mesa, propeller, and canyon are indicated by black arrows. (B) Atomic model of the CVA6 VLP viewed along the 2-fold axis. VP0, VP1, and VP3 are colored in green, blue, and red, respectively. The same color scheme is used throughout, unless otherwise indicated. (C) Good fit between the model and the cryo-EM map at an icosahedral asymmetric unit of the CVA6 VLP. The visualization location with respect to the complete CVA6 VLP map is illustrated in the upper left corner. (D) Good fit between the segmented density (mesh in gray) and the corresponding atomic model (sticks) in the VP1, VP0, and VP3 regions. The well-resolved density for almost all the side chains demonstrates the atomic resolution of the cryo-EM map.

