FIG 2.
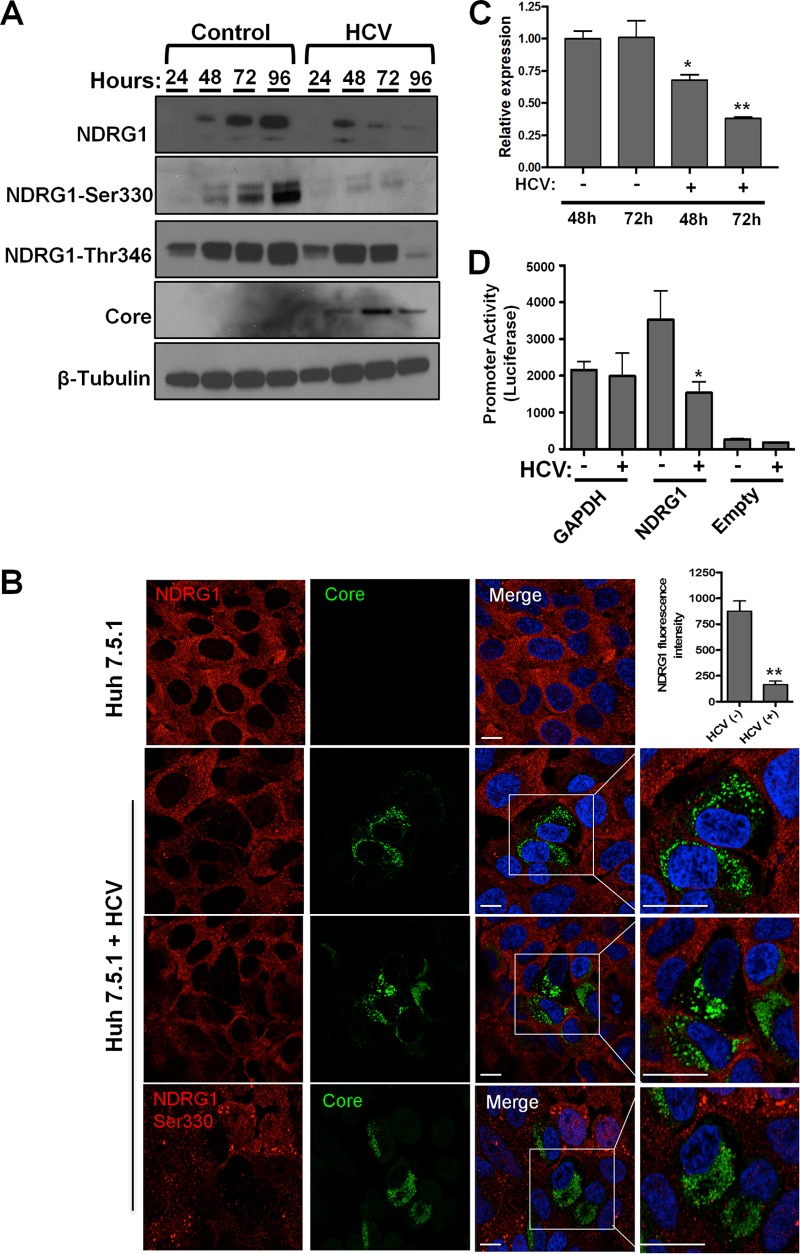
HCV infection reduces NDRG1 mRNA and protein levels. (A) HCV infection reduces NDRG1 protein levels. Huh7.5.1 cells were infected in 12-well plates with HCV, and total protein was isolated at the indicated time points. The indicated proteins were detected by Western blotting (film) using protein-specific antibodies and HRP-conjugated species-specific secondary antibodies. β-Tubulin was used as a loading control. (B) NDRG1 staining is reduced in HCV-positive cells. Knockdown or control uninfected cells were infected with HCV for 48 h and then fixed and stained by using NDRG1-specific antibodies (NDRG1 [top three panels] and phosphospecific NDRG1 Ser330 [bottom panel]) and Alexa Fluor 568 secondary antibody (red). HCV-infected cells were detected with anticore antibody and Alexa Fluor 488 secondary antibody (green). White boxes denote areas magnified three times from the original images. The fluorescent signal in both uninfected and HCV-positive cells (n = 15) was quantified by using ImageJ. (C) NDRG1 mRNA expression is diminished by HCV. Huh7.5.1 cells were infected with HCV, and total RNA was isolated at 48 and 72 h postinfection. NDRG1 mRNA was detected by using RT-qPCR, and the values were normalized to the GAPDH mRNA level. (D) HCV infection reduces NDRG1 promoter activity. Huh7.5.1 cells were transfected with the indicated promoter luciferase constructs for 24 h and infected with HCV for 48 h. Cells were lysed and measured for luciferase activity on a luminometer. Uninfected cells were treated and measured in parallel. The GAPDH promoter was used as a normalization control. In panel A, the image is of one of three independent blots. For panel B, n = 15, and for panels A to D, error bars denote standard deviations. All experiments were performed three times, and the data from a representative experiment are shown. **, P ≤ 0.01; *, P ≤ 0.05 (comparison to the negative controls). Bars, 10 μm.

