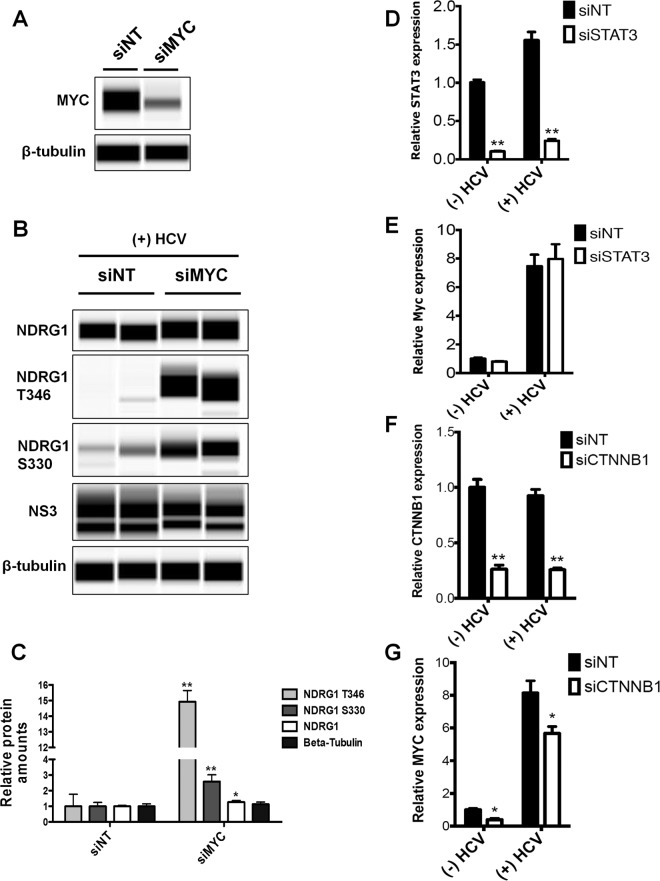
FIG 7.
Roles of MYC and CTNNB1 in regulating NDRG1 levels. (A) Knockdown of MYC. Huh7.5.1 cells were transfected with siRNAs targeting MYC or the control siNT, total protein was isolated 72 h later, and the MYC expression level was measured by Western blotting. (B) HCV-mediated reduction of NDRG1 levels is dependent on MYC. Huh7.5.1 cells were transfected with MYC-specific siRNAs and infected with HCV 48 h later. Total protein was isolated at 72 h postinfection. Proteins were detected by using the indicated antibodies. (C) Quantitation of Western blots. Data from panel B were quantified and normalized to the value for the β-tubulin control. (D and E) Knockdown of STAT3. Huh7.5.1 cells were transfected with control and STAT3-specific siRNAs and infected with HCV. STAT3 and MYC mRNA levels were quantified by RT-qPCR. (F and G) CTNNB1 knockdown. Huh7.5.1 cells were transfected with control and CTNNB1-specific siRNAs and infected with HCV. CTNNB1 and MYC mRNA levels were quantified by RT-qPCR. Error bars denote standard deviations. All experiments were performed three times, and the data from a representative experiment are shown. **, P ≤ 0.01; *, P ≤ 0.05 (compared to the negative controls).

