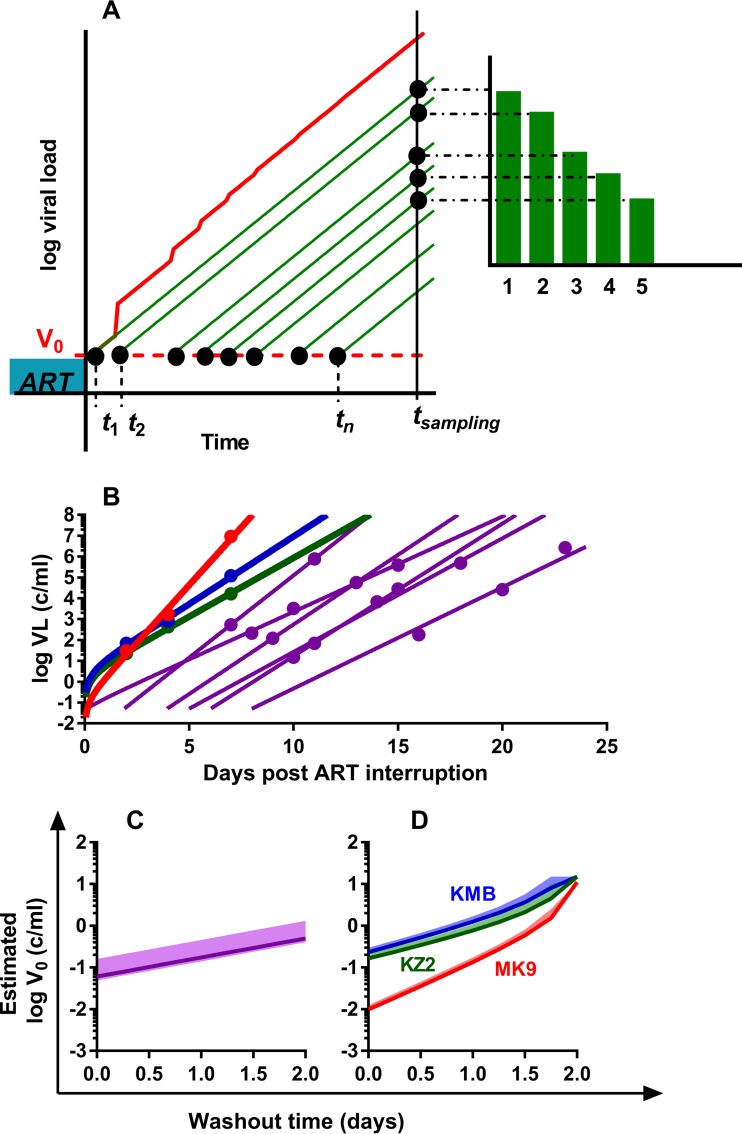
FIG 2.
Estimation of the initial viral load in SIVmac239M-infected macaques. (A) Correcting the trajectory of total viral load in animals with frequent reactivation. In monkeys with frequent reactivation, the total viral load (red) increases faster than the growth of virus from individual reactivation events (green). Time points t1,.,tn are the times of reactivation of individual latently infected cells; green curves are the viral loads of each reactivation founder; the red curve is the total viral load. Green bars are the counts of sequences that correspond to the viral load of i-th rebounder. (B) Best-fit trajectories of viral growth for 9 monkeys. Best-fit trajectories of viral growth for a cohort of three animals with a high reactivation rate, analyzed individually (results for MK9, KMB, and KZ2 are shown by red, blue, and green curves, respectively), and for a cohort of animals treated on day 4 (purple lines, n = 6). (C) Estimated initial viral load of a cohort of 6 animals treated day 4 postinfection, assuming different drug washout times. Solid line, expected median of initial viral load; shaded area, 95% credibility band. (D) Estimated initial viral load for the three individual animals assuming different washout times. Solid line, expected median of initial viral load for each animal (colored as described for panel B); shaded area, 95% credibility band.

