
FIG 2.
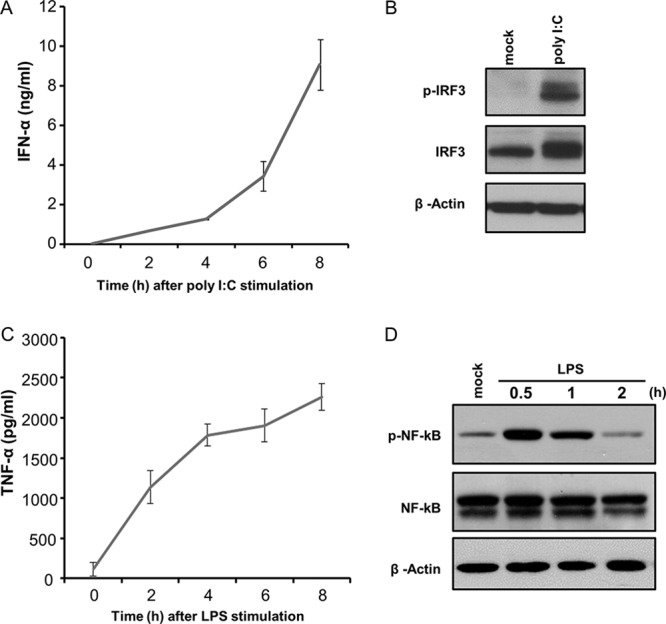
Kinetics of IFN-α and TNF-α responses of porcine AMϕ. (A and C) ZMAC cells were stimulated with poly(I·C) (25 μg/ml) (A) or LPS (100 ng/ml) (C), and the amount of IFN-α (A) or TNF-α (C) present in cell-free culture supernatant at the indicated time after stimulation was determined by ELISA. The results represent the means ± standard deviations of three independent experiments for each agonist. (B) ZMAC cells were either mock treated or exposed to poly(I·C) (25 μg/ml) for 1 h, and their whole-cell lysates were analyzed by Western blotting to detect p-IRF3, total IRF3, and β-actin. (D) ZMAC cells were either mock treated or exposed to LPS (100 ng/ml), and their whole-cell lysates were harvested at the time points indicated and analyzed by Western blotting to detect p-NF-κB, total NF-κB, and β-actin. The results shown are representative of two independent experiments.