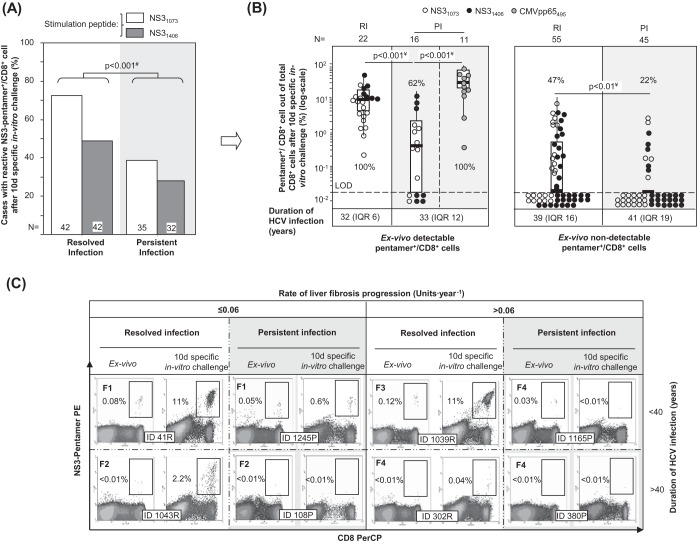
FIG 2.
Antigen-specific reactivity of pentamer+/CD8+ cells. (A) Global frequency of cases with pentamer+/CD8+ cell expansion after 10 days (d) of specific stimulation. (B) Intensity of pentamer+/CD8+ cell proliferation in patients with resolved infection (RI) after treatment and persistent infection (PI), according to the presence of pentamer+/CD8+ cells detectable ex vivo. The percentages of cases with positive expansion are indicated. The duration of infection (in years) is described as the median plus interquartile range (IQR). Box plots summarize the distribution of pentamer+/CD8+ cell frequency after expansion after pooling of all samples tested in each category. (C) Representative dot plots showing pentamer+/CD8+ cells in the upper right quadrant, according to the duration of infection and the rate of liver fibrosis progression both ex vivo and after 10 days of specific in vitro challenge. The Metavir score is displayed in bold in the upper left corner. The percentage of pentamer+/CD8+ cells is in reference to the number of total CD8+ cells. d, day; #, chi-square test; ¥, Mann-Whitney U test; ID, patient identification; LOD, limit of detection.

