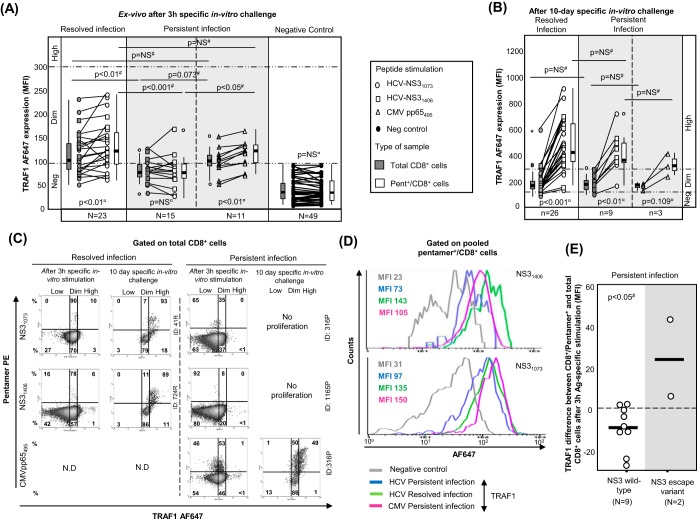
FIG 5.
TRAF1 expression in pentamer+/CD8+ cells. (A and B) MFI of TRAF1 in peripheral total CD8+ and pentamer+/CD8+ cells after 3 h (A) and after 10 days (B) of specific in vitro challenge, depending on the viral control. According to the MFI, TRAF1 expression was categorized as negative (Neg), dim, and high. The box plots summarize the distribution of the TRAF1 MFI in total and pentamer-binding CD8+ cells in each category. (C) Representative dot plots showing TRAF1 expression in pentamer+/CD8+ cells after 3 h and 10 days of specific in vitro challenge in patients with resolved and persistent infections. The data represent the percentage of cells in each area in reference to the number of total CD8+ and pentamer+/CD8+ cells. (D) Histograms of TRAF1 expression by pooled HCV and CMV specific pentamer+/CD8+ cells from all patients with resolved infection after treatment and persistent infection after 3 h of specific stimulation. (E) Difference in TRAF1 expression according to the MFI between NS3 pentamer+/CD8+ and total CD8+ cells from patients with PI infected by wild-type HCV NS3 or an escape variant. Bold lines, median values of the distribution; #, Mann-Whitney U test; ¤, Wilcoxon test. ○, outlier value; *, extreme value; Ag, antigen; MFI, mean fluorescence intensity; ND, not done; Negative Control, T cell labeling with the secondary antibody only; NS, nonsignificant; Pent, pentamer.

