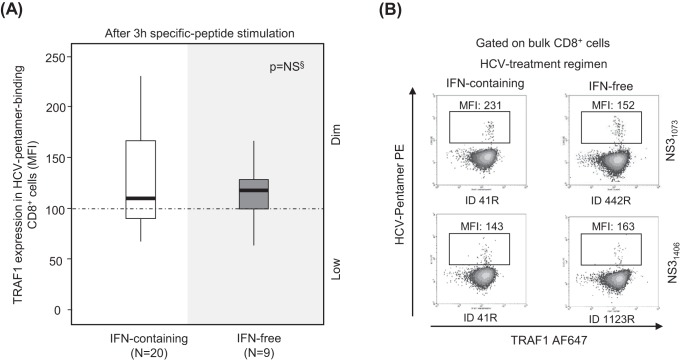
FIG 6.
TRAF1 expression in pentamer+/CD8+ cells from resolved infection cases after interferon-free and interferon-containing regimens. Box plots (A) and representative dot plots (B) showing the level of TRAF1 expression after 3 h of antigen-specific stimulation in HCV pentamer-binding CD8+ cells from sustained virologic responders to interferon (IFN)-containing and -free regimens. MFI, mean fluorescence intensity; NS, nonsignificant; §, Mann-Whitney U test.

