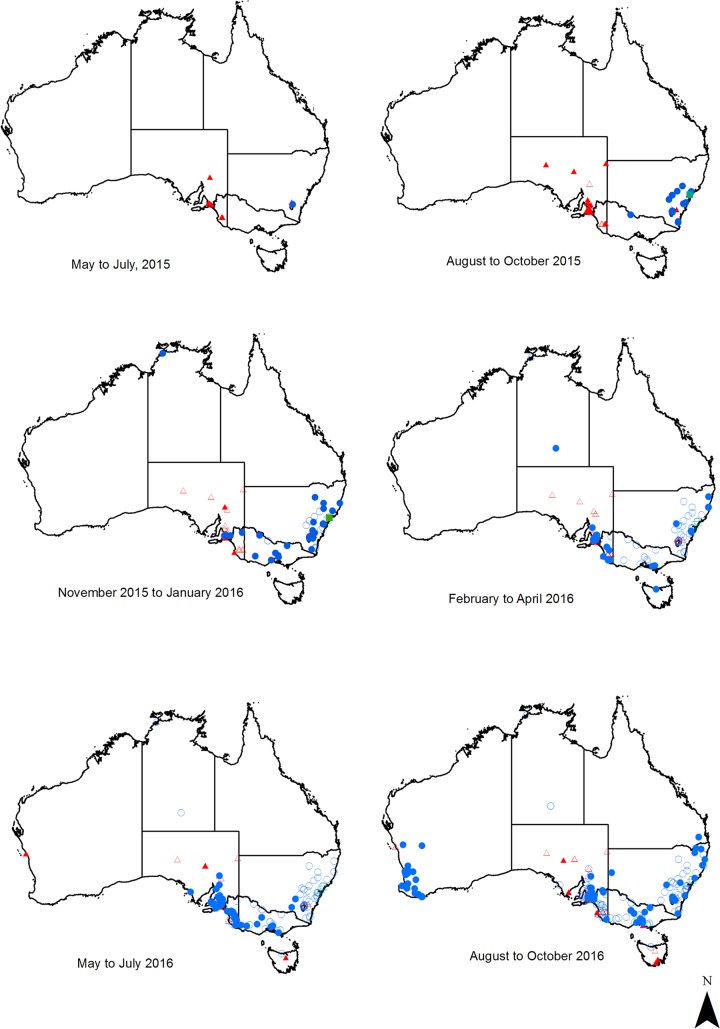
FIG 1.
Pathogenic lagovirus detections in Australia between May 2015 and October 2016. Sites where GI.1 (red triangles), GI.2 (blue circles), and GI.1a-Aus (green squares) were detected are indicated on the map separated into 3-month periods. Filled points indicate detections that were within the respective 3-month period, while hollow points indicate previous detections.

