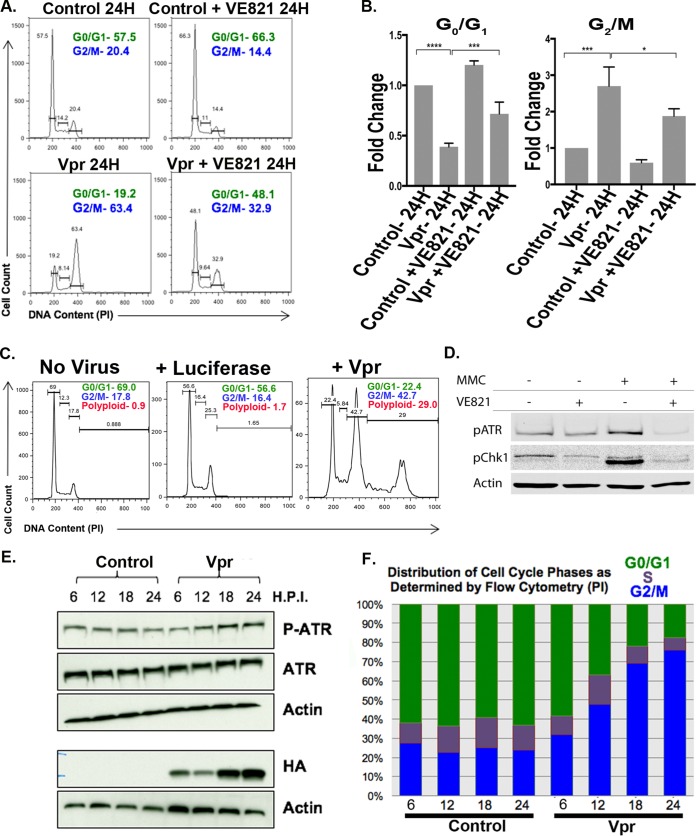
FIG 1.
ATR-dependent G2/M arrest in RTECs. (A) Flow cytometric cell cycle analysis of RTEC line HK2 24 h following transduction with TY2-Vpr-GFP with or without the ATR inhibitor VE821. The x axis shows DNA content, as measured by propidium iodide (PI) staining, and the y axis indicates the relative cell number. The percentages of cells within the G0/G1 and G2/M gates are given in each panel. (B) Quantitation of three replicates of the experiment for which results are shown in panel A. The mean value is plotted for each condition (expressed as fold change), and error bars indicate standard deviations. Asterisks indicate significance by one-way ANOVA: *, P < 0.001; **, P < 0.0002; ***, P < 0.0001. (C) Flow cytometric analysis of uninfected HK2 cells (left) or HK2 cells infected with a lentiviral vector expressing luciferase (center) or Vpr (right). The percentages of cell cycle/ploidy classes are given. (D) VE821 potently inhibits ATR activity in HK2 cells. HK2 cells were either left untreated or treated with mitomycin C (MMC), which induces ATR activity. Active ATR levels were monitored by Western blotting with both a phospho-ATR antibody and an antibody to the phosphorylated (active) form of Chk1 (see Materials and Methods). Actin served as a loading control. (E) Time course of ATR phosphorylation in HK2 cells expressing Vpr from HR-HA-Vpr-GFP (HA-Vpr) as measured by Western blotting. H.P.I., hours postinduction. (F) Corresponding cell cycle phase analysis (by flow cytometry) for the same populations of cells for which results are shown in panel E.

