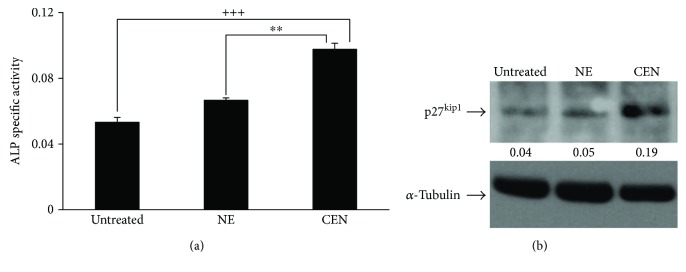
Figure 11.
CEN induces differentiation in SAOs cells. ALP activity, used as differentiation marker, was assayed and expressed as specific activity in SAOs cells (a) after 120 h of treatment with NE and CEN (200 μg/ml, w/v). ALP was determined as reported in Materials and Methods, and specific activity was expressed as O.D. values/min/μg protein. Bar graphs represent the mean ± SD; symbols indicate significance: ∗∗p < 0.01 with respect to NE and +++p < 0.001 with respect to untreated cells. Western blot analysis of p27kip1 protein expression in SAOs cells (b) treated as above. Densitometric analysis (numbers between panels) is expressed as the ratio between p27kip1 and α-tubulin band intensities.

