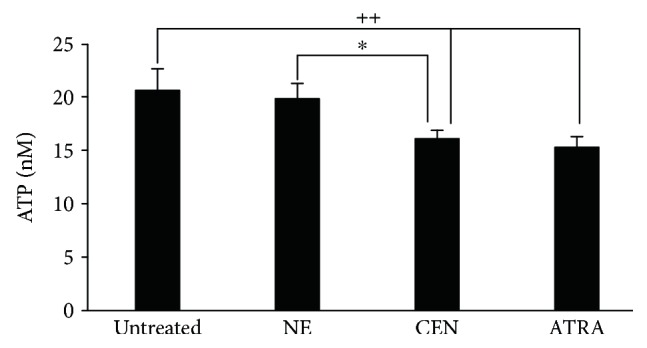
Figure 12.

CEN modifies ATP intracellular levels in SAOs cells. Cells were treated for 24 h with NE, CEN (200 μg/ml, w/v), and 2 μM ATRA (positive control). ATP intracellular concentrations were measured as reported in Materials and Methods and expressed as nM ATP. Bar graphs represent the mean ± SD; symbols indicate significance ∗p < 0.05 with respect to NE and ++p < 0.01 with respect to untreated cells.
