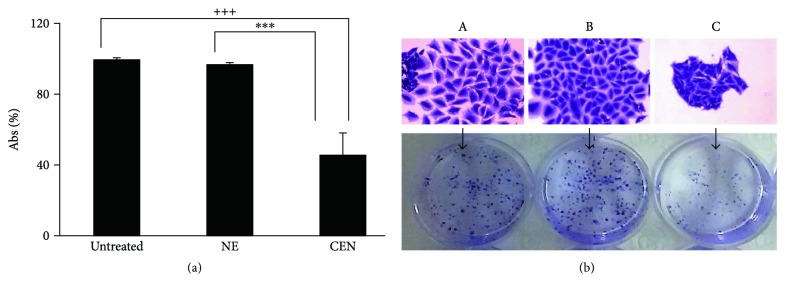
Figure 3.
CEN slowdowns cell proliferation. SAOs cells were treated with NE and CEN (200 μg/ml, w/v) for 12 days. Colony forming assay was performed at the end of incubation as described in Materials and Methods and quantitated in the graph shown in (a). Bar graphs represent the mean ± SD; symbols indicate significance with ∗∗∗p < 0.001 with respect to NE and +++p < 0.001 with respect to untreated cells. (b) Representative photographs are reported of single colony (top) and total colonies (bottom) of untreated (A) cells and those treated with NE (B) and CEN (C) (200 μg/ml, w/v).

