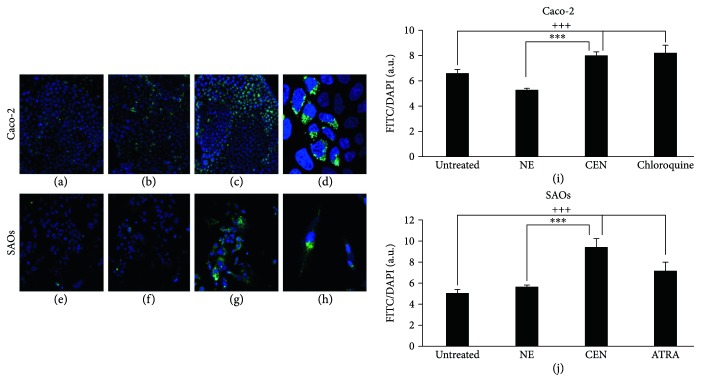
Figure 4.
CEN induces autophagy in Caco-2 and SAOs cells. Representative images of autophagic vacuoles in Caco-2 and SAOs cells: untreated (a, e); after 168 h treatment with NE (b, f); or CEN (400 μg/ml w/v for Caco-2 and 200 μg/ml w/v for SAOs) (c, g), respectively. The photographs were taken with a confocal microscope (LEICA SP8) with a total magnification of 200x. A magnification at 400x of cells in (c, g) is reported in (d, h), respectively, to highlight the autophagic vacuoles (green) and cell nuclei (blue). Autophagosome quantification expressed as FITC/DAPI fluorescence ratio with Cyto-ID kit in Caco-2 (i) and SAOs (j) treated as described above using 20 μM chloroquine and 2 μM ATRA as positive controls, respectively. Bar graphs represent the mean ± SD; symbols indicate significance: ∗∗∗p < 0.001 with respect to NE and +++p < 0.001 with respect to untreated cells.

