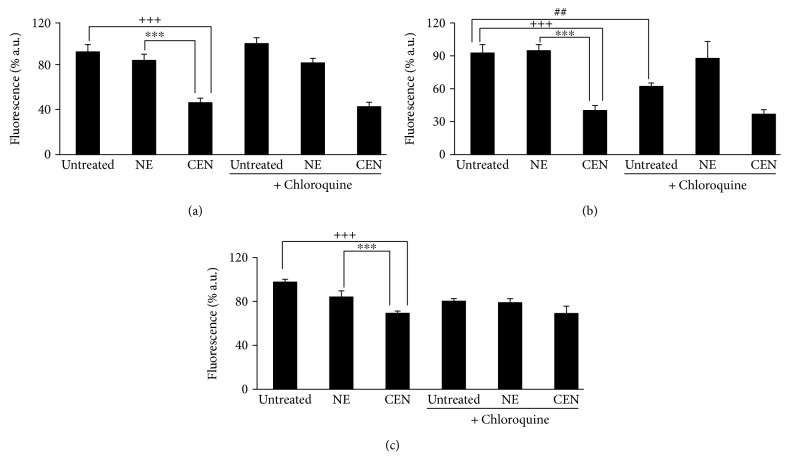
Figure 7.
CEN induces nonprotective autophagy in SAOs (a, c) and Caco-2 (b) cells. Cells were treated for 144 h with different doses of NE and CEN (200 and 400 μg/ml, w/v), respectively, following addition of 20 μM chloroquine during the last 24 h (a), 48 h (b), or for 96 h following the addition of 50 nM bafilomycin A1 (c). CyQuant assay was performed at the end of incubation as described. Bar graphs represent the mean ± SD; symbols indicate significance: ∗∗∗p < 0.001 with respect to NE and +++p < 0.001 with respect to untreated cells; ##p < 0.01 untreated versus untreated + chloroquine; no significant differences between CEN + chloroquine or CEN + bafilomycin A1 versus CEN alone.

