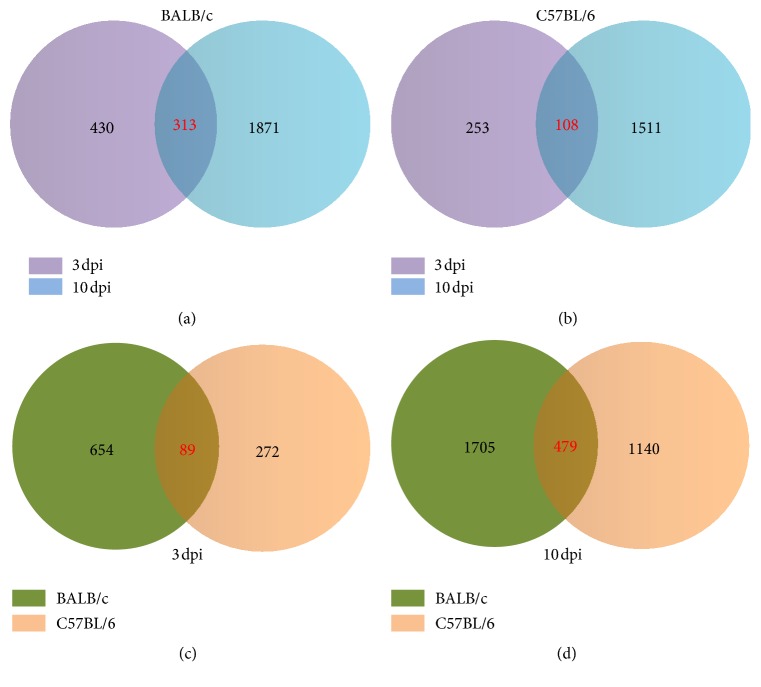
Figure 2.
Analysis of common and unique gene expression differentials in two mouse strains at different times of postinfection. Venn diagrams of differentially expressed genes (DEGs) in BALB/c (a) and C57BL/6 (b) mice at 3 days and 10 days after infection (dpi). Venn diagrams of differentially expressed genes (DEGs) at 3 dpi (c) and 10 dpi (d) in two mouse strains.

