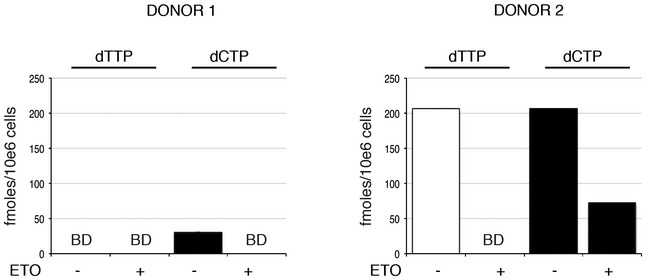
Figure EV1. Quantification of dNTP levels in MDM treated with etoposide (ETO).

Analysis of cellular dNTP levels in unstimulated and ETO‐treated MDM. dNTPs were extracted for quantification from two donors. The bar graph shows the amounts (fmoles per 106 cells) of the indicated dNTP from each donor, with and without ETO treatment. BD: below level of detection.
