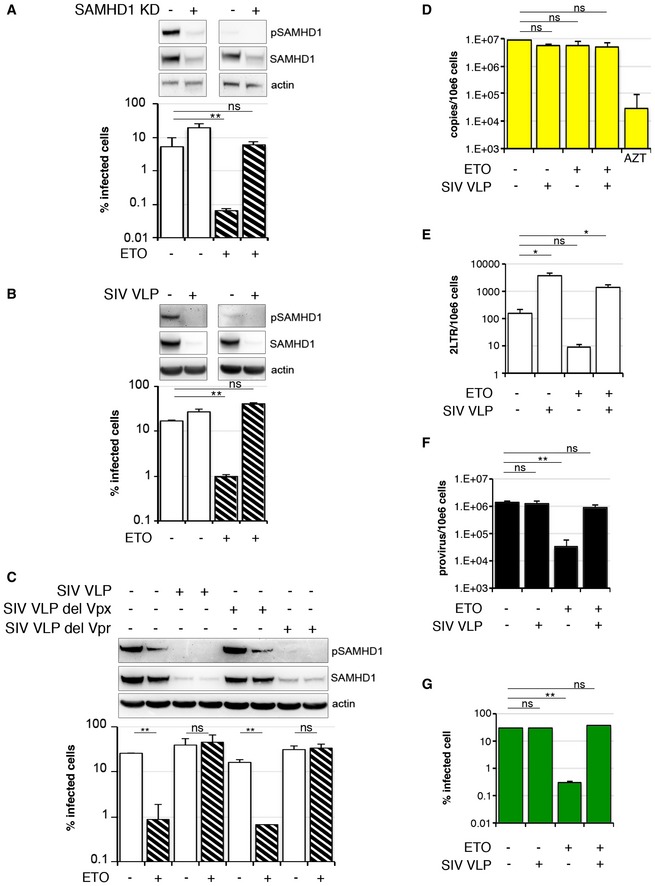
Figure 2. SAMHD1 inhibits HIV‐1 at a post‐RT step following DNA damage.

-
AMDM were transfected with control or pool of SAMHD1 (KD) siRNA and 3 days later treated with 5 μM ETO and infected in the presence of ETO with VSV‐G pseudotyped HIV‐1 GFP 18 h later. Cells from a representative donor were used for immunoblotting. The percentage of infected cells was quantified by the automated cell‐imaging system Hermes WiScan and ImageJ 48 h post‐infection (n = 3, mean ± s.e.m.; **P‐value ≤ 0.01; (ns) non‐significant, paired t‐test).
-
BMDM were treated with 5 μM ETO for 18 h and co‐infected in the presence of ETO with VSV‐G HIV‐1 GFP and SIVmac virus‐like particles containing Vpx/Vpr (SIV VLP). Cells from a representative donor were used for immunoblotting. The percentage of infected cells was quantified by the Hermes WiScan and ImageJ 48 h post‐infection (n = 3, mean ± s.e.m.; **P‐value ≤ 0.01; (ns) non‐significant, paired t‐test).
-
CMDM were treated with 5 μM ETO for 18 h and co‐infected in the presence of ETO with VSV‐G HIV‐1 GFP and SIVmac virus‐like particles containing Vpx/Vpr (SIV VLP) or deleted for Vpx (SIV VLP del Vpx) or deleted for Vpr (SIV VLP del Vpr). Cells from a representative donor were used for immunoblotting. The percentage of infected cells was quantified by the automated cell‐imaging system Hermes WiScan and ImageJ 48 h post‐infection (n = 4, mean ± s.e.m.; **P‐value ≤ 0.01; (ns) non‐significant, paired t‐test).
-
D–FMDM were treated with 5 μM ETO for 18 h and co‐infected in the presence of ETO with HIV‐1 BaL and SIVmac virus‐like particles containing Vpx/Vpr (SIV VLP). DNA was isolated 18 h post‐infection for qPCR quantification of (F) late RT products; (G) 2LTR circles; (H) integrated viral DNA (n = 3, mean ± s.e.m.; *P‐value ≤ 0.05; **P‐value ≤ 0.01; (ns) non‐significant, paired t‐test). (D) Late viral RT products. AZT: MDM treated with 20 μM AZT, a reverse‐transcriptase inhibitor, were used as control. (E) 2LTR circles. (F) Integrated copies of viral DNA, Alu‐Gag qPCR.
-
GThe percentage of infected cells was quantified by Hermes WiScan and ImageJ 48 h post‐infection (n = 3, mean ± s.e.m.; **P‐value ≤ 0.01; (ns) non‐significant, paired t‐test).
Source data are available online for this figure.
