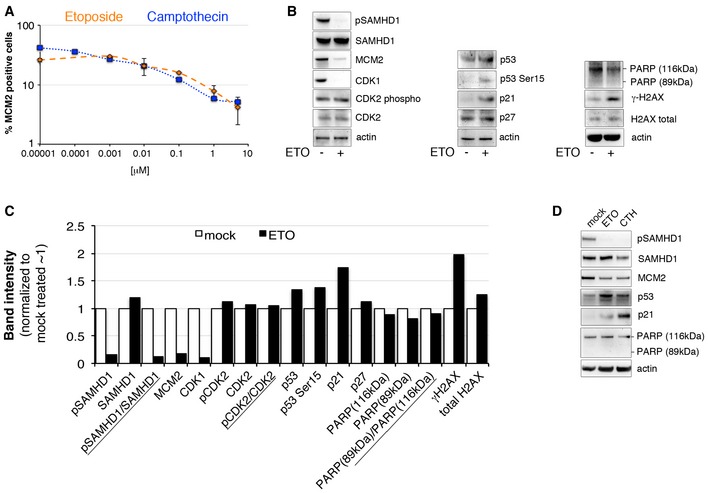
Figure 5. ETO regulates SAMHD1 phosphorylation through the p53, p21 pathway.

- MDM were treated with increasing concentrations of ETO and CTH. Cells were stained for MCM2 expression, acquired and analysed using the automated cell‐imaging system Hermes WiScan and ImageJ. On average, 104 cells were acquired (n = 3, mean ± s.e.m.).
- MDM were treated with 5 μM ETO, lysed and immunoblotting performed to detect cell cycle/cell cycle arrest and DNA damage‐associated proteins.
- Quantification of specific proteins band intensities from immunoblot in panel (B) using a CCD camera. Intensities of protein bands were normalized to intensity of actin protein band.
- MDM were treated with 5 μM ETO or 0.01 μM CTH for 18 h, lysed and immunoblotting performed to detect cell cycle/cell cycle arrest and DNA damage‐associated proteins.
