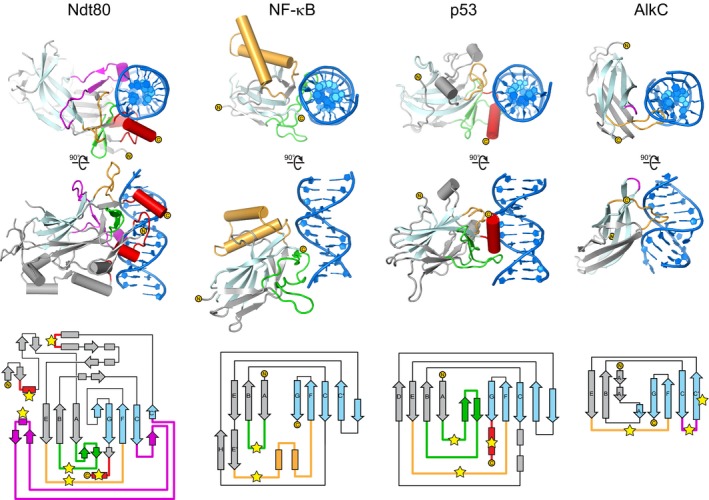
Figure EV1. Comparison of DNA binding Ig folds.

The top two rows show orthogonal views of DNA‐bound structures of Ig‐like domains from three eukaryotic transcription factors Ndt80 (PDB 1MNN), NF‐κB (PDB 1A3Q), and p53 (PDB 1TUP), compared to that of PfAlkC (this work). Topology diagrams of each structure are shown at the bottom and are colored the same as the crystal structures. The two β‐sheets within the Ig core are colored gray (A, B, D, E, Eʹ, and H) and pale cyan (C, Cʹ, F, and G). Regions contacting the DNA are colored green (AB‐loop), magenta (CCʹ‐loop), orange (EF‐loop), and red. Points of contact with the DNA in are marked with yellow stars in the topology diagram.
