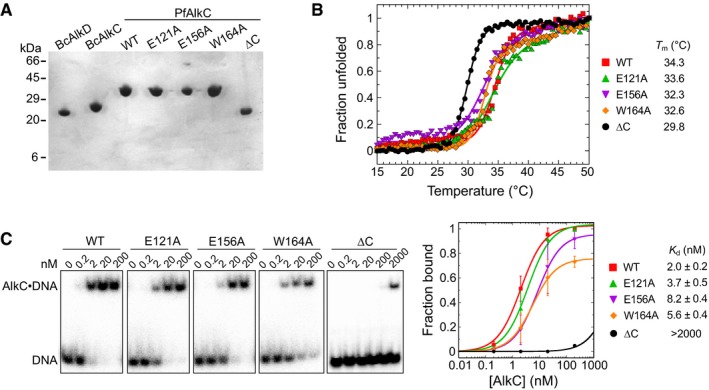
Figure EV2. Characterization of PfAlkC proteins used in this study.

- SDS–PAGE of purified proteins, stained with Coomassie Blue.
- Thermal denaturation of wild‐type and PfAlkC mutants monitored by circular dichroism. The fraction of unfolded protein was expressed as the normalized molar ellipticity at 222 nm. Melting temperatures (T m) were derived by fitting the data to the equation (fraction unfolded) = 1/(1 + e(Tm−T)/k), where k denotes the cooperativity of the transition. Although PfAlkC∆C has a lower T m than the full‐length proteins, it is properly folded at 21°C at which biochemical assays were performed.
- Electrophoretic mobility shift assay for PfAlkC mutants binding to 1 nM THF‐DNA of the sequence 32P‐d(GACCACTACACT(THF)ATTCCTAACAAC)/d(GTTGTTAGGAAT(T)AGTGTAGTGGTC) in 25 mM HEPES (pH 7.5), 50 mM KCl, 5 mM DTT, 5% glycerol, and 0.05 mg/ml BSA at 21°C for 30 min. Concentrations of PfAlkC are shown at the top of the representative gels. Electrophoretic separation was carried out on a Novex™ TBE gel (ThermoFisher Scientific). Quantitation is plotted on the right, in which each value is the mean ± SD (n = 3). Equilibrium dissociation constants (K d) were extracted by fitting the data to a two‐state binding model.
