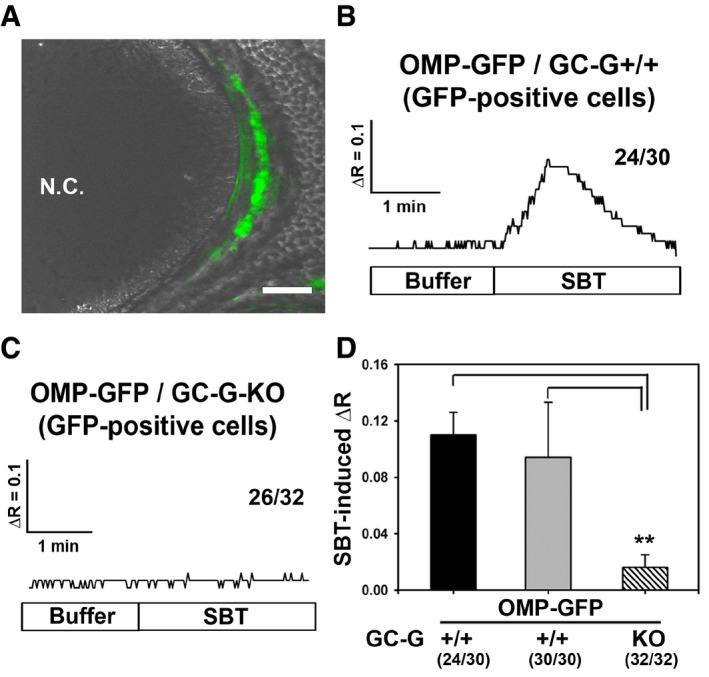
Figure 4. Reduction in SBT‐evoked Ca2+ responses in GG neurons of GC‐G‐KO mice.

-
AMicroscopical image of a tissue slice through the GG of an OMP‐GFP pup. GG neurons are labeled in green due to intrinsic GFP fluorescence (GFP fluorescence was merged with the transmitted‐light channel). N.C., nasal cavity. Scale bar: 50 μm.
-
B, CRepresentative ratiometric Ca2+ transients following exposure to SBT (1 μM) in GFP‐positive GG neurons from OMP‐GFP/GC‐G+/+ (B) and OMP‐GFP/GC‐G‐KO (C) pups. The numbers on the right‐hand side represent the number of cells with Ca2+ transients similar to what is shown in the respective graph over the total number of measured cells. For OMP‐GFP/GC‐G+/+ or OMP‐GFP/GC‐G‐KO mice, the GG neurons originated from three slices (obtained from different animals).
-
DQuantification of SBT‐evoked ΔR in GG neurons from OMP‐GFP/GC‐G+/+ and OMP‐GFP/GC‐G‐KO mice. SBT‐induced ΔR was calculated by subtracting the baseline fluorescence ratio (340/380 nm) at 37°C in the absence of SBT from the peak fluorescence ratio measured upon exposure to SBT. For OMP‐GFP/GC‐G+/+, the black bar indicates SBT‐evoked ΔR for the 24 SBT‐responsive GG neurons, while the gray bar denotes SBT‐induced ΔR for all 30 analyzed GG neurons from three slices (obtained from different animals). For OMP‐GFP/GC‐G‐KO, the shaded bar indicates SBT‐evoked ΔR for 32 GG neurons analyzed from three slices (obtained from different animals). Data are mean ± SD; two‐tailed t‐test **P < 0.01.
