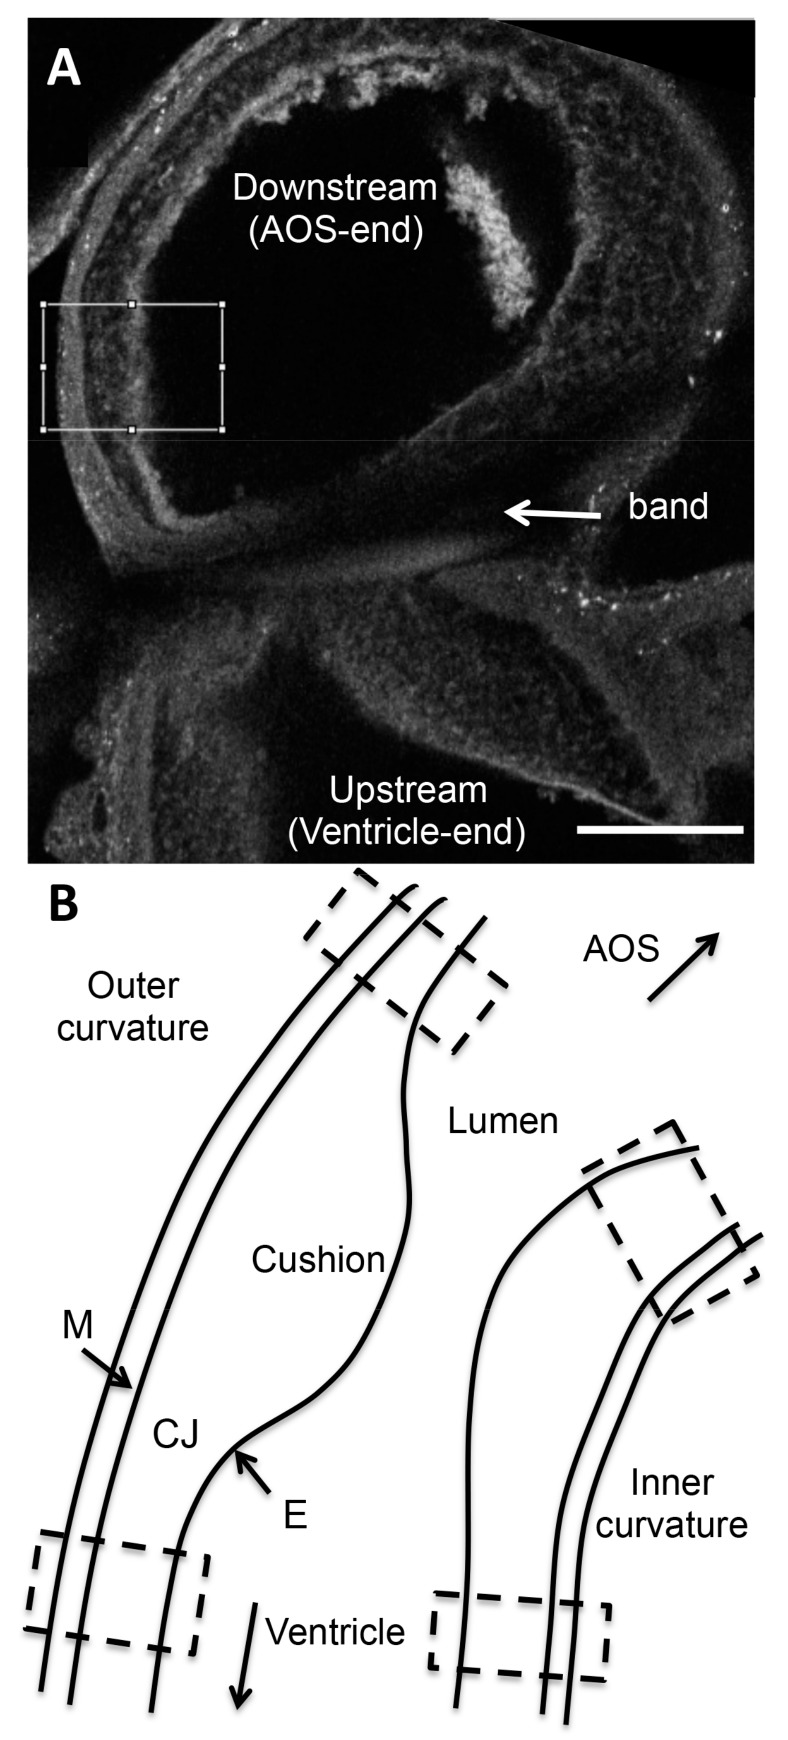
Figure 1.
Intensity based confocal image analysis. (A) Example confocal image of the outflow tract (OFT) shown in grayscale. Intensities analyzed are grayscale pixel intensities (0 to 255 to represent black to white, with 255 defined as a saturation intensity). An example region of interest (ROI) selection (white box) is shown on this banded embryo immunostained for collagen VI. The box spans the three layers of the OFT wall (from left to right: myocardium, cardiac jelly, endocardium), downstream of the band location. Scale bar, 100 µm. (B) Schematic of the control OFT depicting the four regions in which confocal image intensity was analyzed (hatched boxes): downstream (closer to AOS) inner curvature, downstream outer curvature, upstream (closer to ventricle) inner curvature, upstream outer curvature. In banded embryos, the band is located in the mid-portion of the OFT, in between depicted hatched boxes. AOS, aortic sac; M, myocardium; CJ, cardiac jelly; E, endocardium.

