Figure 3.
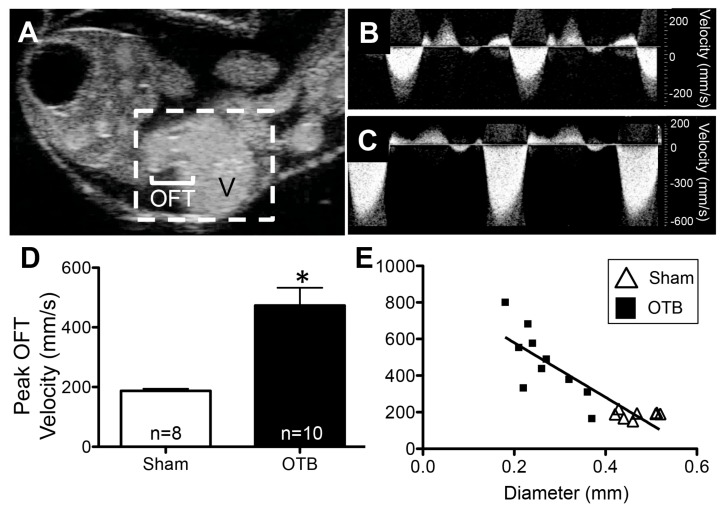
Ultrasound imaging at HH24 demonstrates increased blood flow velocity in the OTB group. (A) B-mode ultrasound image of the HH24 chicken heart (hatched white box). Blood can be seen pumping from the ventricle (V) through the outflow tract (OFT). In this still-frame image, the OFT lumen (white) is surrounded by darker OFT cushions, comprised of cardiac jelly. Example blood flow velocity waveforms in the OFT obtained from (B) control and (C) OTB embryos. (D) Peak OFT velocity was significantly larger in OTB embryos. * p < 0.05 via t-test. (E) Plot of peak OFT blood flow velocity versus maximum diameter of the OFT at the constriction site in banded embryos (squares) or equivalent location in sham controls (open triangles) demonstrates the relationship between band tightness and peak velocity increase.

