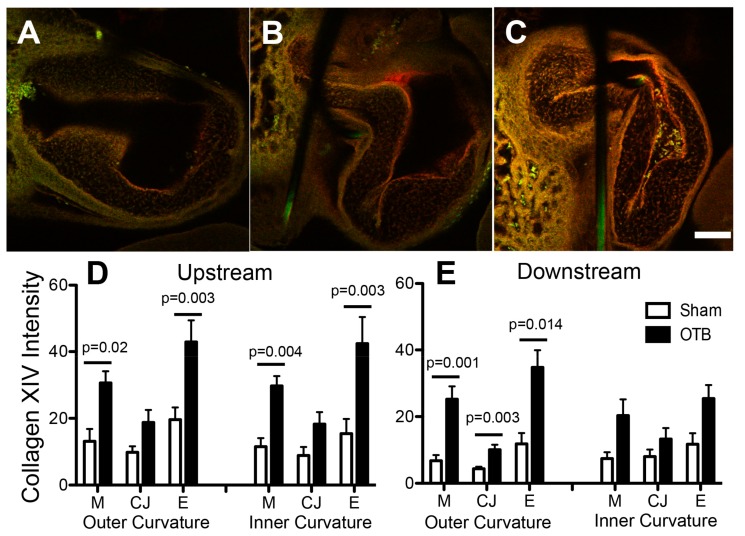
Figure 9.
Collagen XIV deposition in the sham and banded OFT. Example confocal images are shown for (A) a sham control, (B) a moderately banded embryo, and (C) a tightly banded embryo. Collagen XIV deposition depicted in red, innate autofluorescence of the tissue depicted in green. Overlapping expression appears yellow-orange. Image intensity analysis results are depicted for (D) upstream of the band site (closer to the ventricle) and (E) downstream of the band site in both the inner and outer curvatures of the OFT in each layer of the OFT wall (M, myocardium; CJ, cardiac jelly; E, endocardium). Sham data is shown in open bars, banded (OTB) data is shown in black bars. Intensity values represent pixel grayscale intensity. p values denote significance between sham and banded groups where appropriate. Data shown as mean ± SEM. Scale bar, 100 µm.

