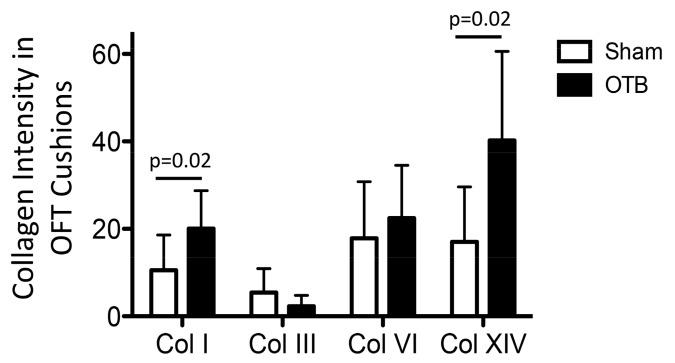
Figure 11.
Deposition of collagens I, III, VI, and XIV in the endocardial cushions of the sham and banded OFT. Intensity analysis results from atlas-based registration are shown for sham controls (open bars) and banded groups (OTB, black bars). The analysis was done based on intensities in the cushion proper region, closed to the endocardium (see Figure 2). Intensity values represent pixel grayscale intensity. p values denote significance between sham and banded groups where appropriate. Data shown as mean ± SEM. Please note that intensity measurements are relative to each specific collagen analyzed and do not represent abundance of the different collagen types in the heart wall (e.g., collagen I is much more abundant than collagen XIV, even though intensity values seem to suggest the opposite).

