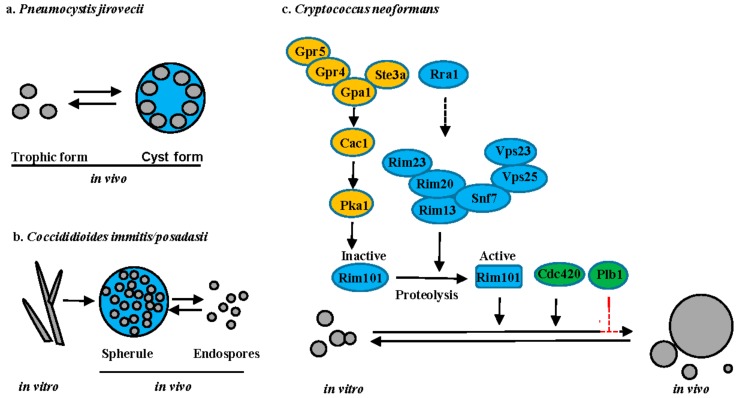
Figure 5.
Changes in cell size upon interaction with host. (a) P. jirovecii; (b) C. immitis; and, (c) C. neoformans. Signaling pathways are illustrated with different colors: cAMP-PKA (yellow), Rim101 (blue) and others (green). Solid lines or arrows represent direct regulation. Dotted lines or arrows represent indirect or unknown regulation. Positive and negative relationships between components are illustrated in black and red, respectively. Transcription factors are illustrated as rectangles and other proteins illustrated as ovals.

