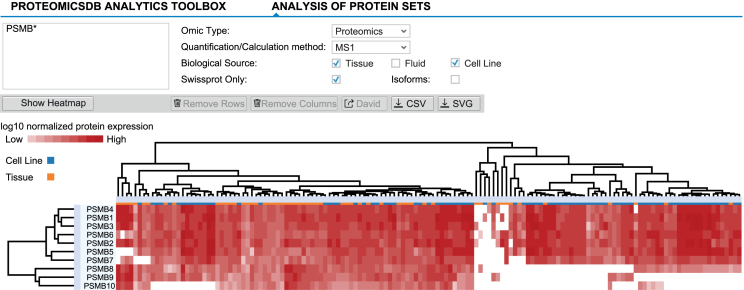
Figure 4.
Expression heatmaps of multiple proteins across different tissues, fluids and cell lines can be displayed via the ‘Expression heatmap’ functionality of the ‘Analytics’ tab. Proteins and biological sources are shown as rows and columns, respectively. The dendrograms show the result of hierarchically clustering proteins and biological sources, respectively. Branches can be selected and either removed or used to perform GO-enrichment analyses (proteins). Here, all beta-units of the proteasome are displayed, suggesting differential expression of the canonical (expression of PSMB5, 6 and 7) and induced (expression of PSMB8, 9 and 10) proteasome across tissues and cell lines.

