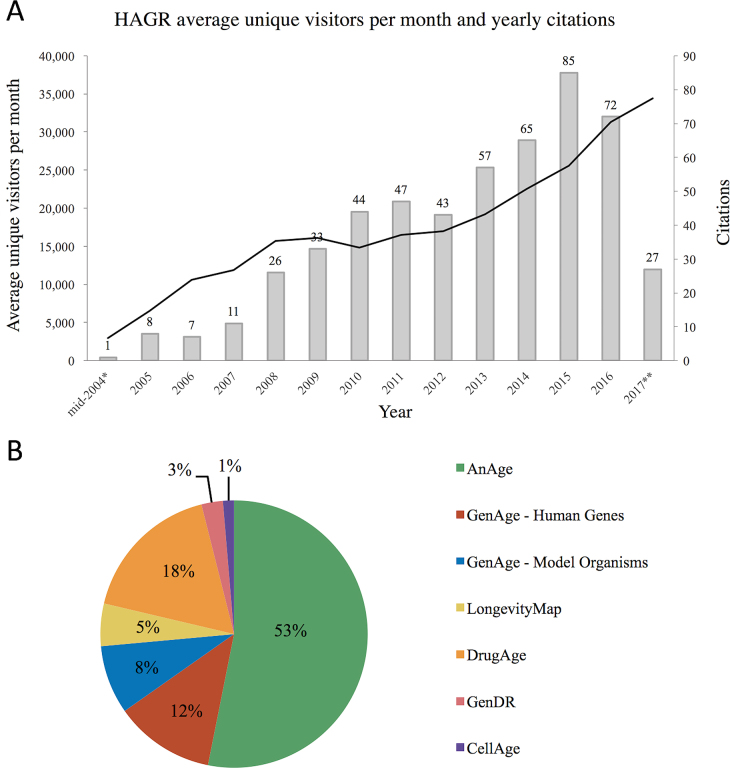
Figure 2.
(A) Combined HAGR and senescence.info unique visitors per month (black line). The secondary axis and grey bars show the yearly growth in HAGR citations *HAGR became publicly available online in mid-2004. **Data to end of August 2017. (B) Usage by percentage of the different HAGR databases in 2017.

