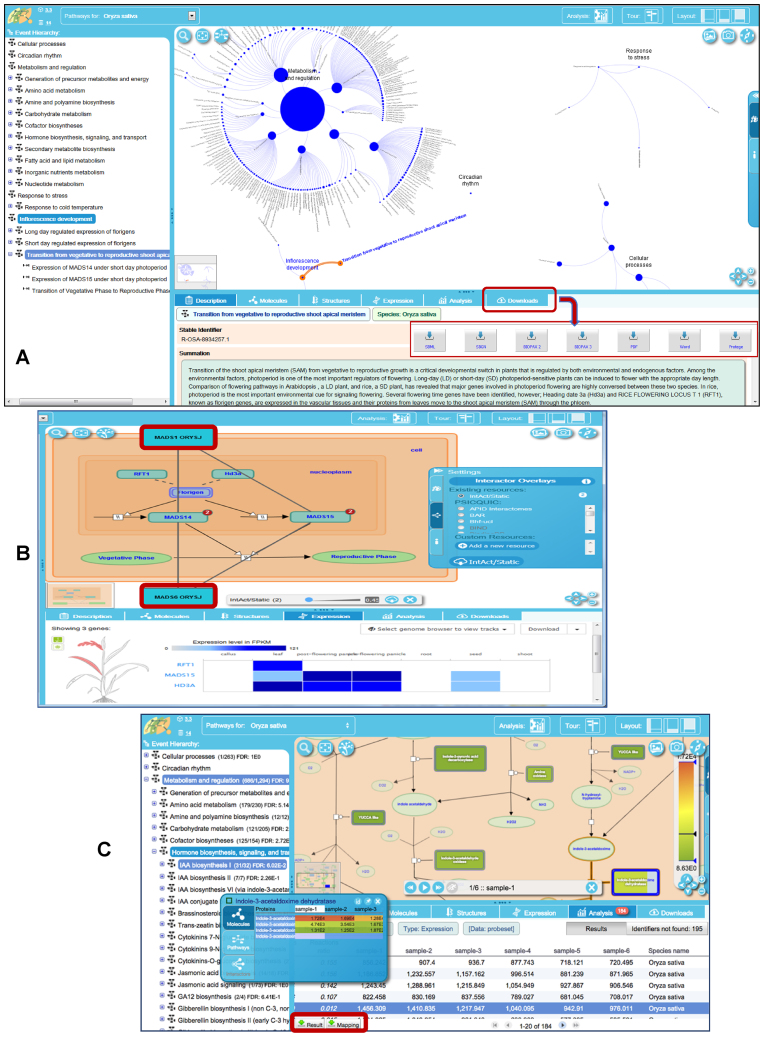
Figure 2.
Plant Reactome pathway views and functionalities. (A) The ‘Fireworks’ pathway visualization platform displays a navigation panel (left) and a hierarchical graph of pathways in a pathway viewer window with various associated features, such as summation, download options, and links to external public resources providing complementary information on various pathway entities. (B) A view of the Plant Reactome pathway displaying an overlay of gene–gene interaction data. Two common interactors of the MADS15 and MADS14 transcription factors (MAD1 ORYS and MAD6 ORYS, shown in red boxes) were imported via web services from the IntAct database. (C) Analysis and visualization of user-uploaded gene expression data on the pathway browser, with options to explore full expression profiles of the homologs and download results.

