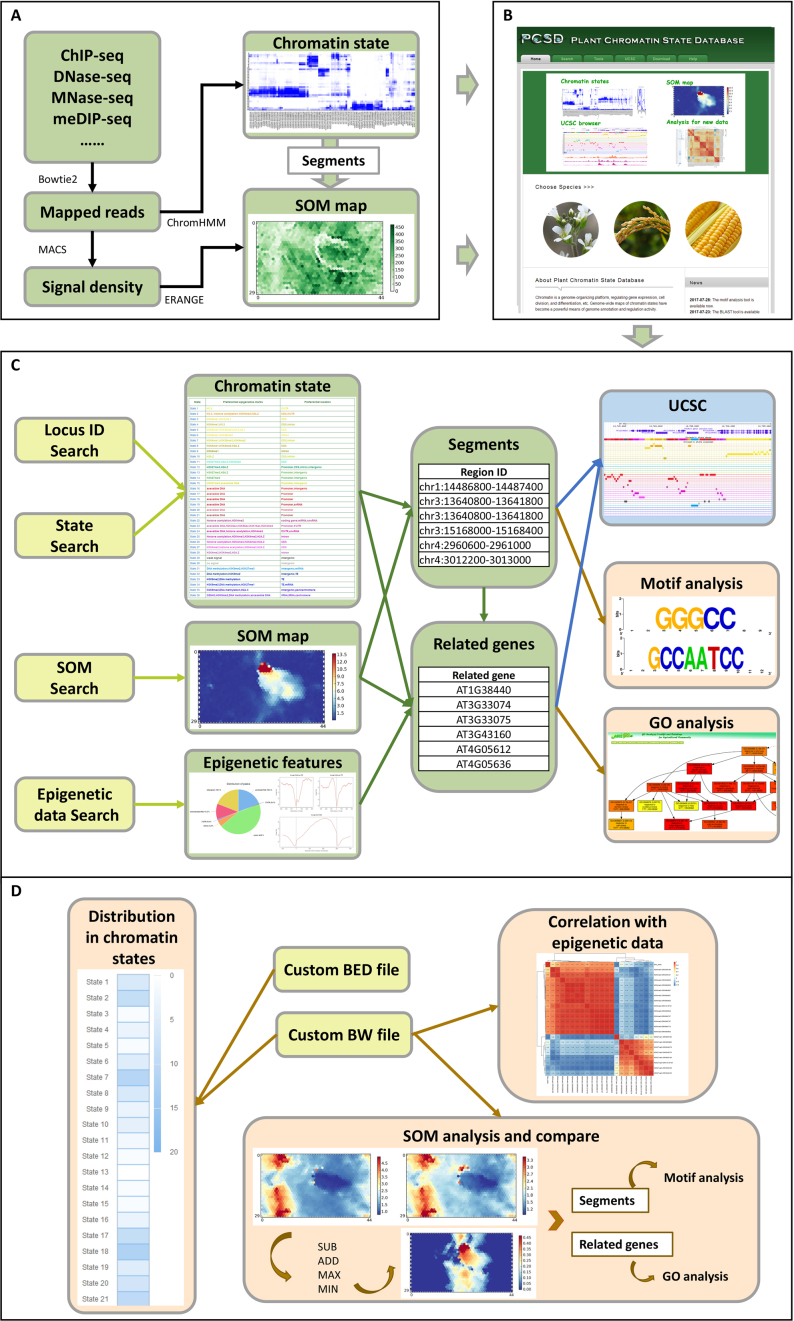
Figure 1.
An overview of PCSD. (A) Workflow of PCSD construction. We collected public and in-house epigenomic data sets in Arabidopsis thaliana, Oryza sativa and Zea mays. After quality control, we mapped the high-quality reads to reference genomes with bowtie2 software. The mapped reads were used for genome segmentation and definition of the chromatin states with ChromHMM. All segments were put into 1,350 units of an initialized SOM map. The trained SOM map was applied with ERANGE software according to the signal density, which was calculated by MACS software. The chromatin states and trained SOM maps were used for PCSD construction. (B) Homepage of PCSD. Information on the chromatin state and SOM map for a species can be searched by clicking on the species on the homepage. Basic functions, including search, analysis, UCSC view, download and help, can be quickly accessed in the navigation bar. (C) Search function of PCSD. In PCSD, users can search chromatin states by submitting locus ID and search detailed information about chromatin states by a state search. Each state is represented by a colour. The active states are represented by warm colours, whereas the repressed states are represented by cool colours. SOM search was used to search and compare different SOM maps. Epigenetic features can be displayed after an epigenetic data search. Then, users can find detailed information on segments and segment-related genes. The states marked by different colours and epigenetic mark signals around segments and genes are shown in the UCSC Genome Browser. To further investigate the function of segments and related genes, motif analysis and GO analysis were provided in PCSD, respectively. (D) Analysis functions of PCSD. In PCSD, users can conduct custom analysis using bigwig (BW) files or BED files to calculate the average signals or number of genomic regions in each chromatin state, respectively. The correlation with our collected data can be shown after uploading a custom BW file for epigenetic marks. The signal density in the custom BW file can be mapped to the trained SOM maps. Two different SOM maps can be compared by means of subtraction, addition, maximum, and minimum. Users can obtain detailed information on segments and related genes in the units of SOM maps, and motif and GO analysis were provided for functional analysis of segments and genes, respectively.

