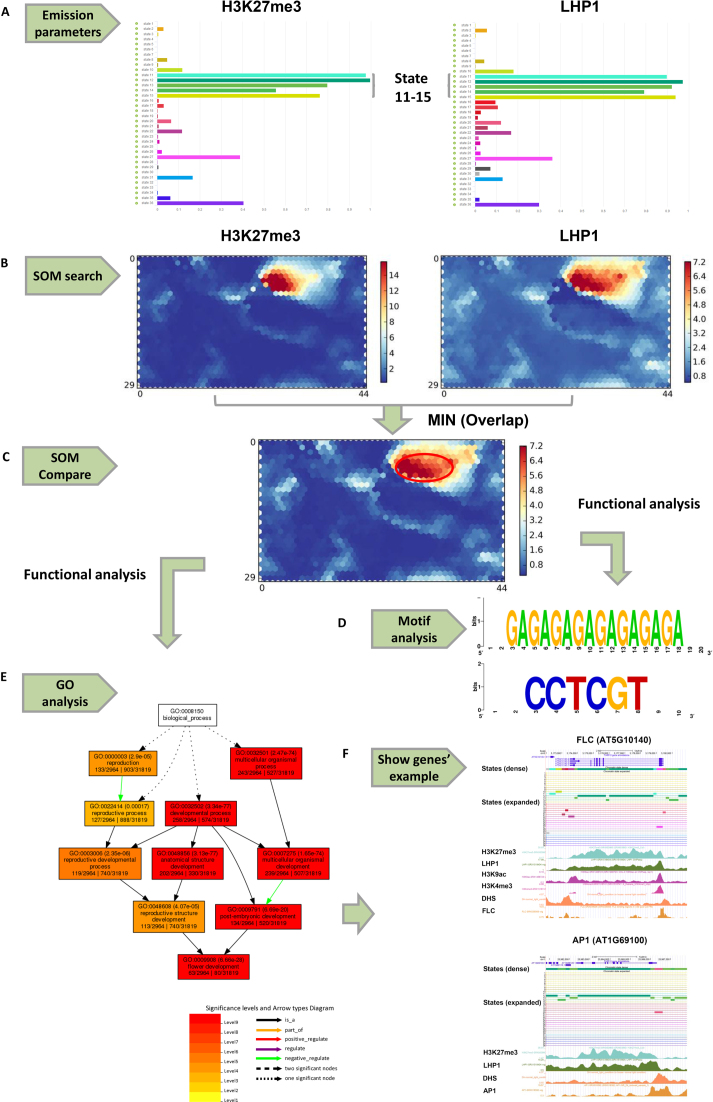
Figure 3.
An example of analysis and comparison for H3K27me3 (SRX853860) and LHP1 (SRX1519404) in chromatin states and SOM maps. (A) Emission parameters of H3K27me3 and LHP1 in 36 states. (B) SOM maps of H3K27me3 and LHP1 by SOM search. (C) SOM comparison between the two SOM maps in (B). The compared SOM map is the result of the minimum between H3K27me3 and LHP1 to explore the overlapping units. The red ellipse encompasses the main units with common signals between H3K27me3 and LHP1. (D) Functional analysis for segments in units with a common signal form the SOM map in (C). Selected enriched motifs (‘GAGAGAGAGAGAGAGA’ and ‘CCTCGT’) in the segments are shown. (E) Functional analysis of related genes in units with a common signal from the SOM map in (C). Selected enriched GO terms (GO terms related to flower development) in related genes are shown. (F) Selected genes (FLC and AP1) used for GO analysis associated with chromatin states and epigenetic marks in the UCSC Genome Browser.

