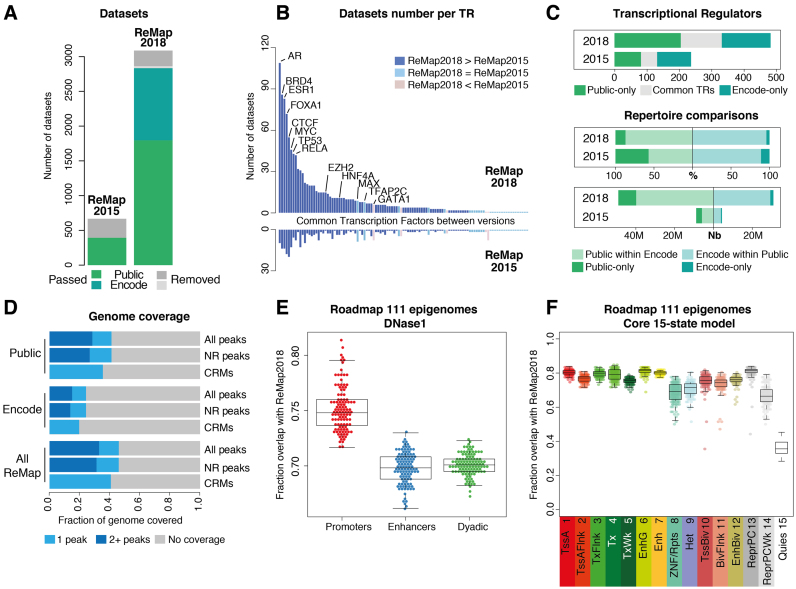
Figure 1.
Overview of the ReMap database expansion. (A) Analyzed datasets growth in ReMap 2018 compared to ReMap 2015. (B) Evolution of the number of datasets per TRs, ranked across common between both ReMap versions. (C) Common TRs between Public and ENCODE sets of data (gray). Direct comparison of Public and ENCODE repertoire, defined as percentages (%), and as number (Nb) of peaks. (D) Genome coverage fraction of each ReMap dataset (NR non-redundant, CRM Cis Regulatory Modules). (E) Comparison of DNase I-accessible regulatory regions against the ReMap 2018, regions from the Roadmap Epigenomics Consortium defining promoter-only, enhancer-only or enhancer–promoter alternating states (Dyadic). Each dot represents the fraction overlap with ReMap 2018 for one of the 111 epigenomes. (F) Comparison of the Roadmap Epigenomics Consortium chromatin states annotations against the ReMap 2018 catalog, using the Core 15 chromatin states model, and a minimum overlap of 50% between regions. Each dot represents the overlap for one of the 111 epigenomes. Chromatin state definitions and abbreviations are as follows; 1 Active TSS (TssA), 2 Flanking active TSS (TssAFlnk), 3 Transcr. at gene 5′ and 3′(TxFlnk), 4 Strong transcription (Tx), 5 Weak transcription (TxWk), 6 Genic enhancers (EnhG), 7 Enhancers (Enh), 8 ZNF genes + repeats (ZNF/Rpts), 9 Heterochromatin (Het), 10 Bivalent/poised TSS (TssBiv), 11 Flanking bivalent TSS/Enh (BivFlnk), 12 Bivalent enhancer (EnhBiv), 13 Repressed Polycomb (ReprPC), 14 Weak repressed Polycomb (ReprPCWk), 15 Quiescent/low (Quies).

