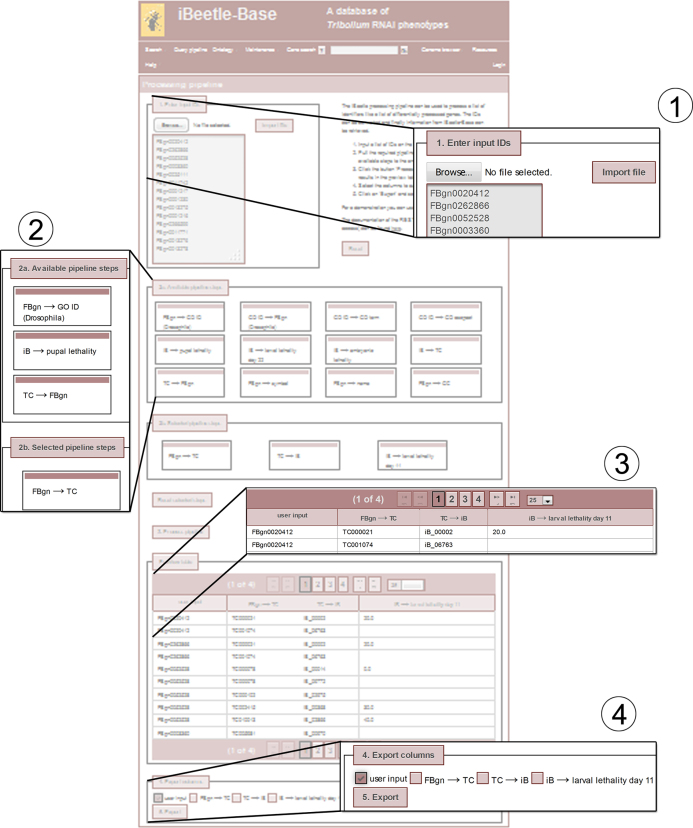
Figure 1.
The figure shows a screenshot of the webpage for the query pipeline. The complete page is shown as transparent structure in the background. Important parts are enlarged. The workflow and the numbering of the cut-outs are: Step 1: Input a list of identifiers, or upload a text file with identifiers with one ID per row. Step 2 a/b: Drag and drop the required pipeline steps from ‘2a. Available pipeline steps’ to ‘2b. Selected pipeline steps’. Step 3: A click on the Button ‘3. Process pipeline’ executes the pipeline and presents the data in the preview table. Step 4: The preview table shows the output of each selected pipeline step. Step 5 Selected columns are exported to a csv file.

