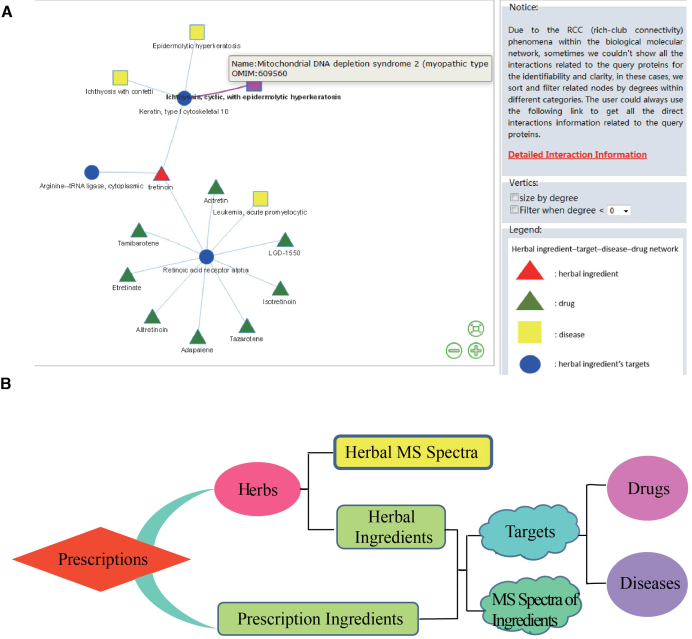
Figure 1.
Data display and structure of TCMID 2.0. (A) An herbal ingredient-target network as an illustration for the new visualizations of networks. The red triangle stands for the ingredient used for query; the blue circle stands for targets of ingredients; the green triangle stands for the herbal targets related drugs; the yellow square stands for the herbal targets related diseases. Information text of nodes is reachable when users drag the mouse over one node and the colour of the node will turn to purple. Direct interaction information related to the query node can be viewed through the link in the right tooltip. (B) An illustration of internal connections among each data piece.

