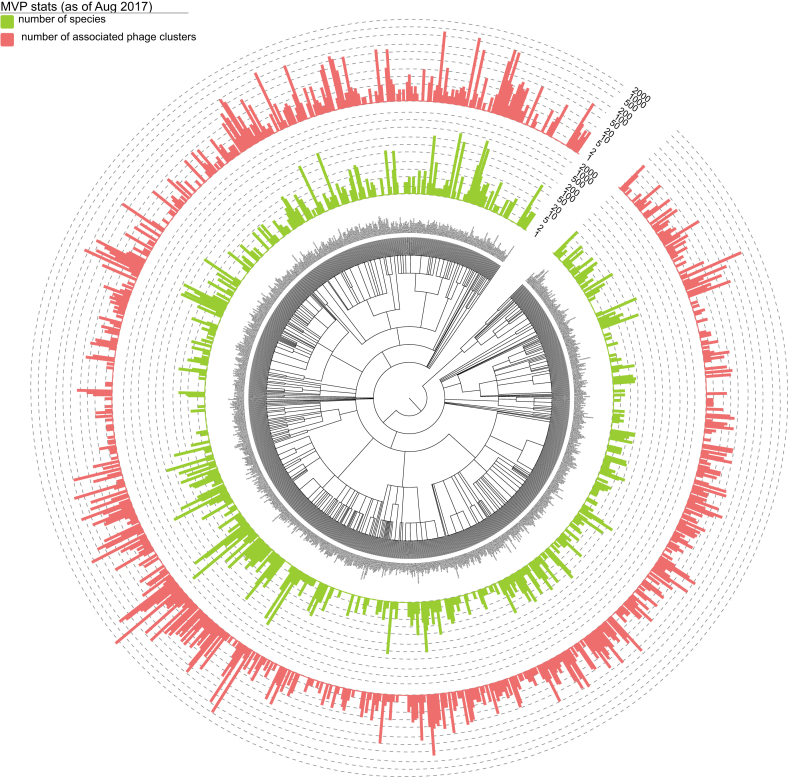
Figure 1.
Distribution of the 9245 prokaryotic hosts across the bacterial and archaeal phylogeny at the genus level according to NCBI taxonomy and their associated phage clusters. For each bacterial and archaeal genus-level group, the number daughter species collected in MVP and the corresponding number of associated virial clusters (unique count) are indicated with light-green and red bars. Bacterial and archaeal species that are not collected in MVP are not shown. Bar heights are log-transformed. The tree and the datasets were visualized using Evolview, an online visualization and management tool for customized and annotated phylogenetic trees (55). An interactive version of the tree can be found at: http://www.evolgenius.info/evolview/#shared/mvp2017_stats/462.

