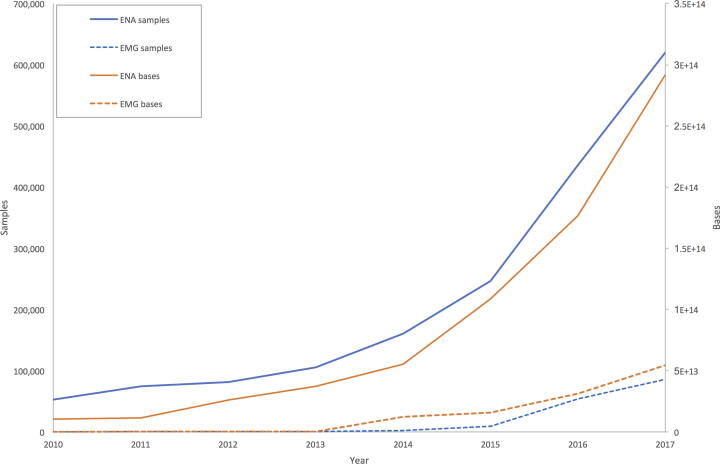
Figure 6.
Growth of metagenomics data housed in ENA and processed by EBI Metagenomics (EMG). This graph shows the cumulative growth of environmental data in the two resources (ENA: solid lines, EMG: dashed lines) according to two different metrics: numbers of samples (blue) and number of bases (orange).

