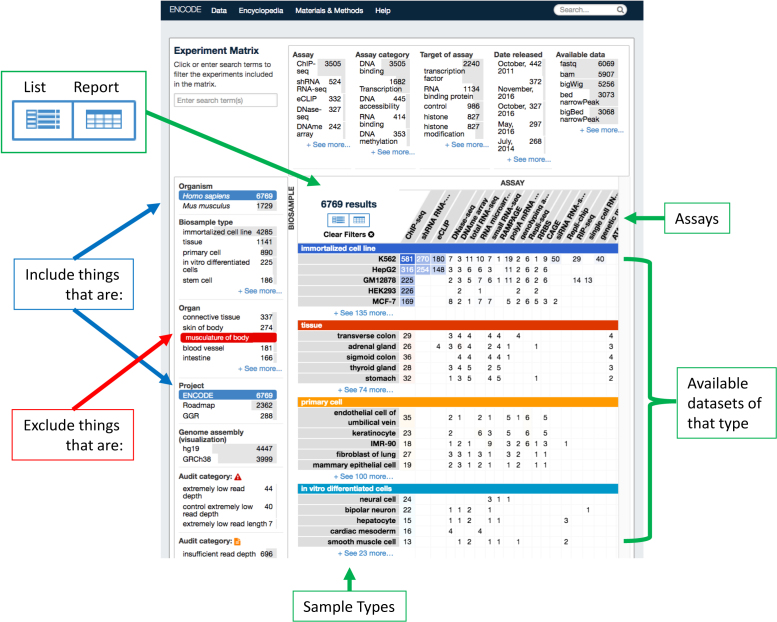
Figure 2.
The Data Matrix. Screenshot of the Data Matrix. To the left of the matrix are faceted search bars that can be used to positively selected (blue) and negatively select (red) for certain data types on several metadata properties. The matrix itself correspond to a count (with links) to datasets done on certain sample types by certain assays. Clicking on the count—takes the user to a list of the datasets, as does clicking on the ‘list’ icon. Metadata for the data displayed in the Data Matrix and be obtained by clicking on the ‘report’ icon and downloaded in .tsv format.

