Figure 5.
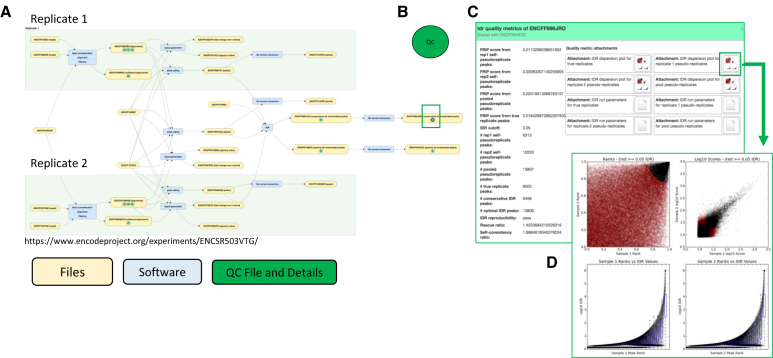
Pipelines, Provenance and Quality Checks. (A). The File Association Graph for experiment (ENCSR503VTG) is shown. Files and processes specific to each replicate are shown in the green shaded area. Files and processes that are either independent of (genome assembly) or derived form a union of the replicates are shown in the white background. Yellow ovals correspond to accessioned files at the DCC and their accession numbers are all shown. When quality control is run on a given file, a green circle (B). appears and takes users to the quality metrics (C and D). Blue ovals indicate a process done to transform (map, sort, score, etc.) the individual files.

