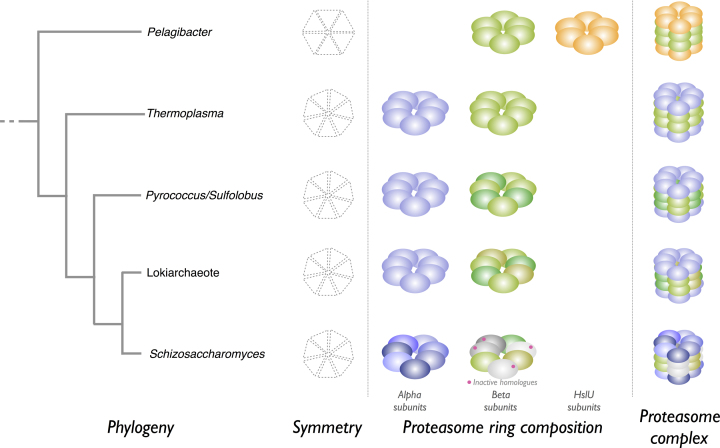
Figure 2.
Examples of proteasome complexes. Schematic representations of proteasome complexes from selected organisms are shown. The predicted relationship between the organisms is shown as a simplified phylogenetic tree at the left of the figure. The symmetry of each ring, ring composition and structure of the complexes are shown; these are hypothetical for proteasomes from Pyrococcus, Sulfolobus and the Lokiarchaeote. Homologues of peptidase family T1 are shown as filled spheres: alpha subunits are shown in shades of blue, and beta subunits in shades of green (proteolytically active subunits) and grey (proteolytically inactive). The unrelated HslU subunits are shown as orange spheres.

