Figure 1.
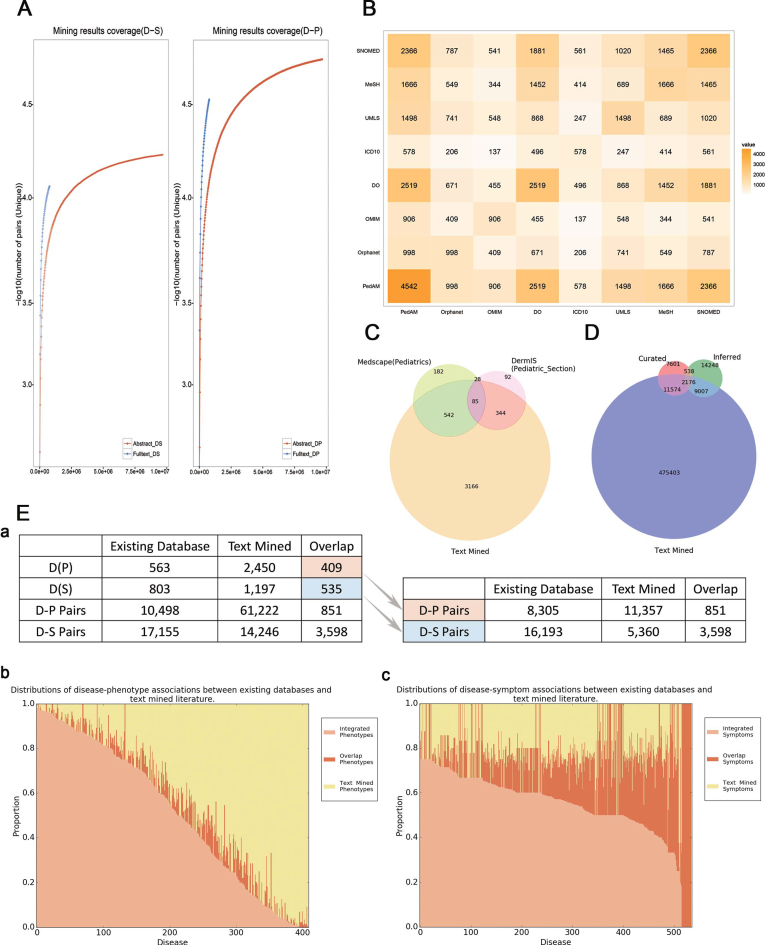
(A) Text-mined result coverage. Left panel shows the comparison of text-mined sentences containing symptoms from abstracts and full-text articles. Right panel shows the comparison of text-mined sentences containing phenotypes from abstracts and full-text articles. The y-axis represents the number of sentences containing disease-related phenotypes for each disease. DS stands for Disease-Symptom pairs while DP stands for Disease-Phenotype pairs. (B) Overlaps among different disease resources. The symmetric matrix shows the number of overlapping diseases between all pairs of primary name sources according to PedAM mapping. Colors and numerals represent the overlapping degree in disease counts. Source abbreviations: DO—Disease Ontology. (C) Overlaps among the major disease sources. Venn diagram for the major sources of disease names in PedAM. (D) Overlaps among the major gene sources. Venn diagram for the major sources of disease related genes in PedAM. (E) (a) Statistics of diseases and D-M pairs which have phenotypic annotation between existing databases and text mined literature. (b) Distributions of disease-phenotype associations between existing databases and text-mined literature. The x-axis represents diseases which phenotypic annotation comes from both existing databases and literature, while y-axis represents the proportion of disease corresponding phenotypes. (c) Distributions of disease-symptom associations between existing databases and text-mined literature. The x-axis represents diseases which phenotypic annotation comes from both existing databases and literature, while y-axis represents the proportion of disease corresponding phenotypes.

