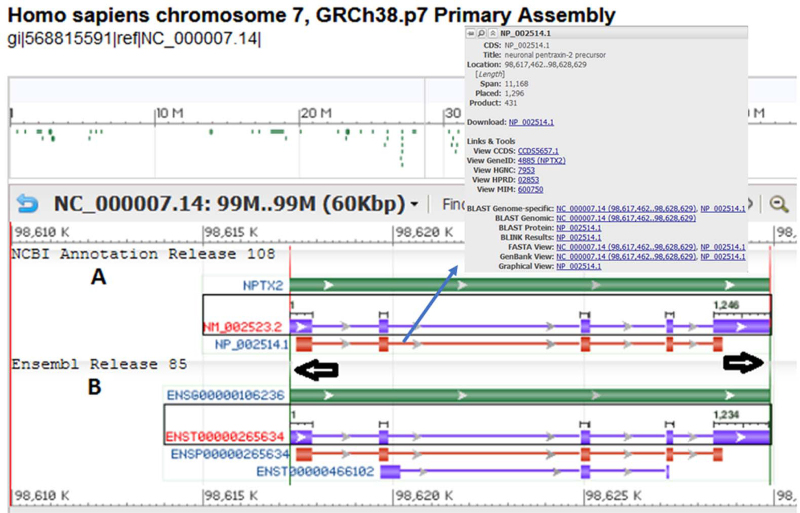
Figure 4.
A view of the graphical display accessed from the report page of CCDS3542.1 (https://www.ncbi.nlm.nih.gov/CCDS/CcdsBrowse.cgi?REQUEST=ALLFIELDS&DATA=CCDS3542&ORGANISM=0&BUILDS=CURRENTBUILDS) using the purple ‘S’ icon. (A) Transcripts and proteins from NCBI Annotation Release 108. (B) Transcripts and proteins from Ensembl Release 85. The green bar indicates the gene; transcripts are shown in purple and proteins are shown in red color. Positioning the cursor over any of these objects (gene, transcript or protein) opens a tool tip which includes additional information and links. Proteins in the NCBI annotation display that are in the CCDS set include a link to the CCDS ID in the tool tip. The gray box to the right (indicated by vertical arrow) is the tool tip corresponding to the protein accession NP_002514.1. Differences between any two objects can also be revealed as vertical lines (indicated by horizontal arrows) when the objects (NM_002523.2 and ENST00000265634 in the figure) are selected using the ‘Control’ or ‘Command’ button on the keyboard.

