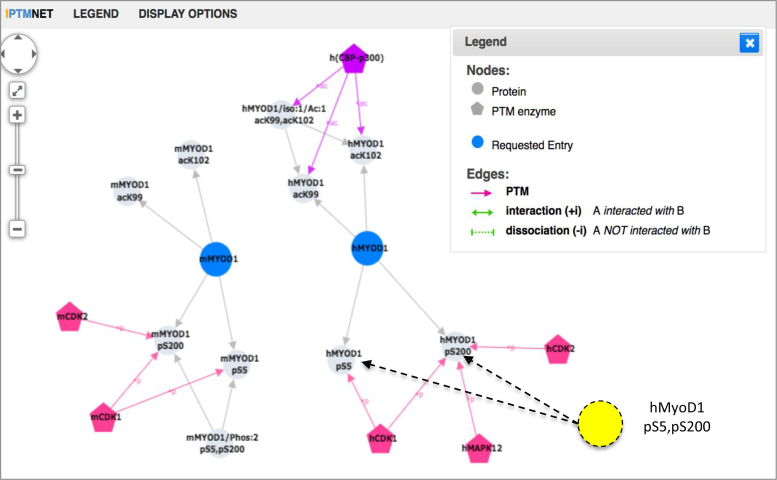
Figure 6.
iPTMnet Network View for human and mouse MYOD1. The Cytoscape-based network view shows MYOD1 protein/proteoforms-PTM site (grey edges) and PTM enzyme-PTM site relationships (pink edges). The yellow node is a human proteoform that can be inferred based on the mouse proteoform, given that both sites and kinase involved are conserved (node added manually). To facilitate view, many other PTM nodes and edges have been hidden.

