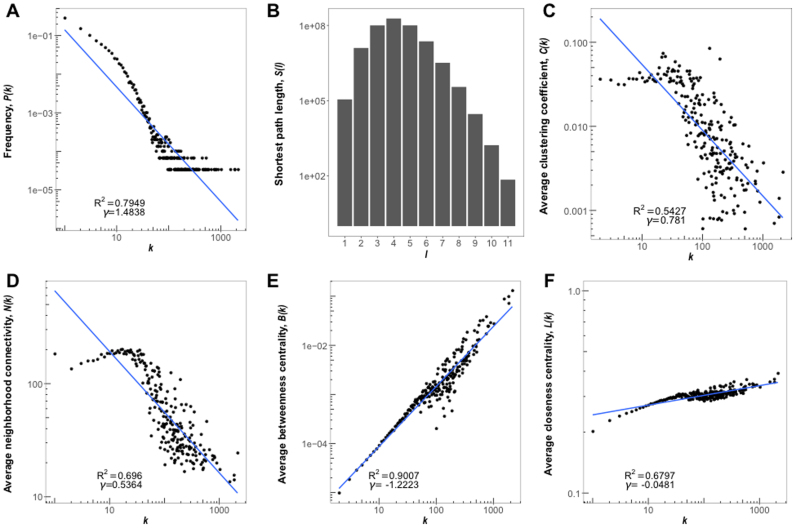
Figure 3.
Characteristics of the human RNA interactome in RISE. (A) Degree distribution of the RNAs. (B) Distribution of the shortest path between pairs of RNAs. (C) Degree distribution of the average clustering coefficients of the RNAs. (D) Degree distribution of the average neighborhood connectivity. (E) Degree distribution of the average betweenness centrality of the RNAs. (F) Degree distribution of the average closeness centrality of the RNAs. The blue lines show the regression in log-space.

