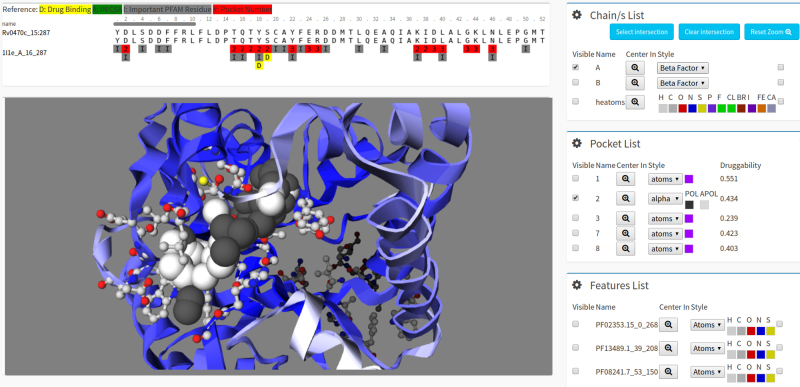
Figure 2.
Protein structures visualization in Target-Pathogen. The different visualization tabs that are available when searching for proteins in Target-Pathogen are shown. The table above shows the alignment to the corresponding crystal structure or template model. Other tabs present structure related data, including the interactive pocket visualization module. The visualization module allows (i) to select which pocket to show (ticking the corresponding pocket Select field), (ii) display present HETATMS (37), assigned CSA (38) or PFAM relevant residues, (iii) display the protein in different styles. In the druggable pocket of the example shown below, we depict polar alpha spheres of pocket ‘1’ in black while its apolar α spheres in white. The HETATMS found in the crystal structure are shown as balls and sticks in different colours.

