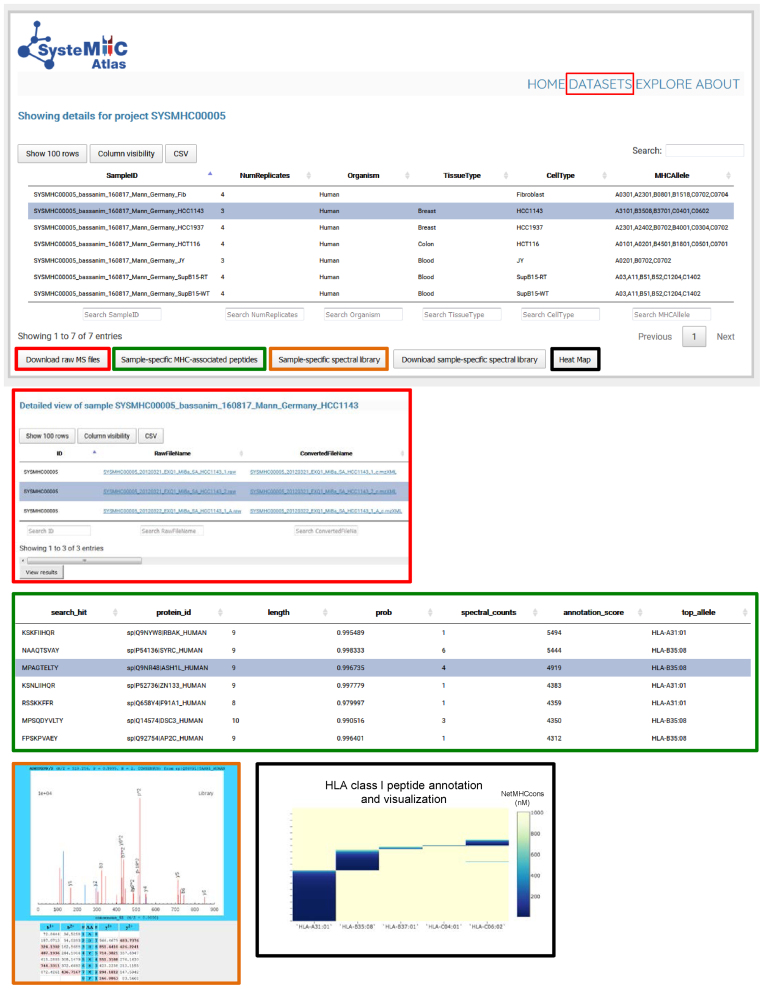
Figure 5.
Data storage and visualization. To access information about specific datasets, the user selects a specific SYSMHC ID/Project name (e.g. SYSMHC00005) and clicks on ‘view dataset’ at the bottom left of the screen. The samples related to this project are then listed and linked to the number of replicates, organism, tissue and cell type of origin as well as the HLA typing information (upper panel). The user can then click on a specific Sample ID to visualize the metadata and to download the raw or converted mzXML MS files (red squares). A list of sample-specific HLA-associated peptides can be visualized at 1% peptide-level FDR (green squares). Sample-specific spectral libraries, including consensus fragment ion spectra, can be visualized and downloaded (orange and blue squares). Heat maps (black squares) are used to visualize the annotation of individual peptides to their respective HLA allele (dark blue peptides are predicted to be strong HLA binders according to NetMHCcons).

