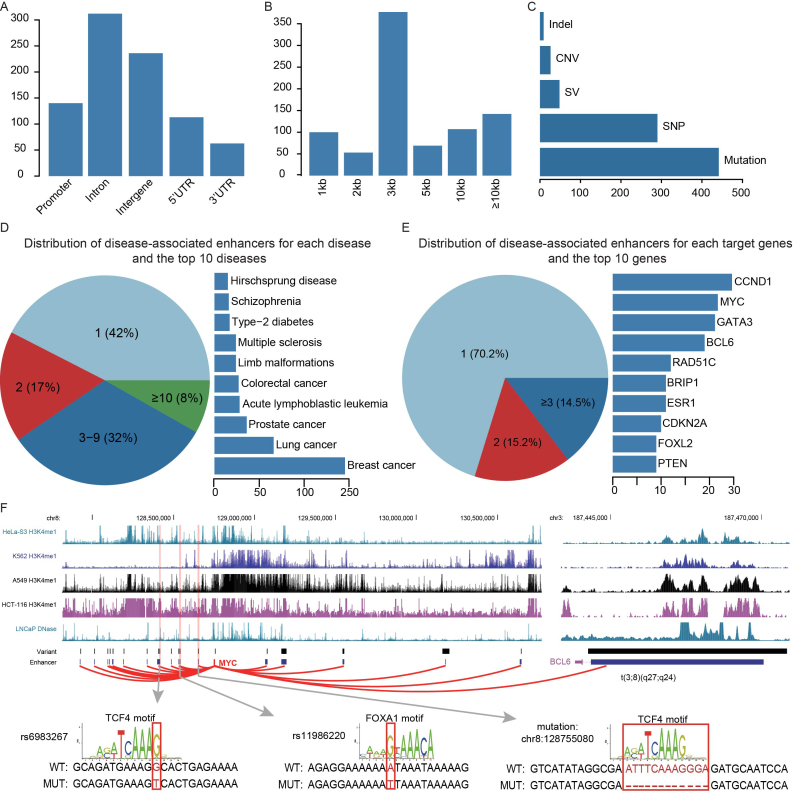
Figure 2.
Statistics of DiseaseEnhancer. (A) The distribution of disease-associated enhancers in genomic elements. (B) The width of disease-associated enhancers. (C) The distribution of genetic variation types. (D) Majority of the diseases harbor less than 10 disease-associated enhancers (left). And the top 10 diseases ranked by associated enhancers are shown (right). (E) Part of the target genes were regulated by more than a single enhancer (left). And the top 10 genes ranked by associated enhancers are shown (right). (F) The twenty two disease-associated enhancers affected MYC in eight diseases. The sequence of three enhancers and the affected transcription factor motifs are also shown.

