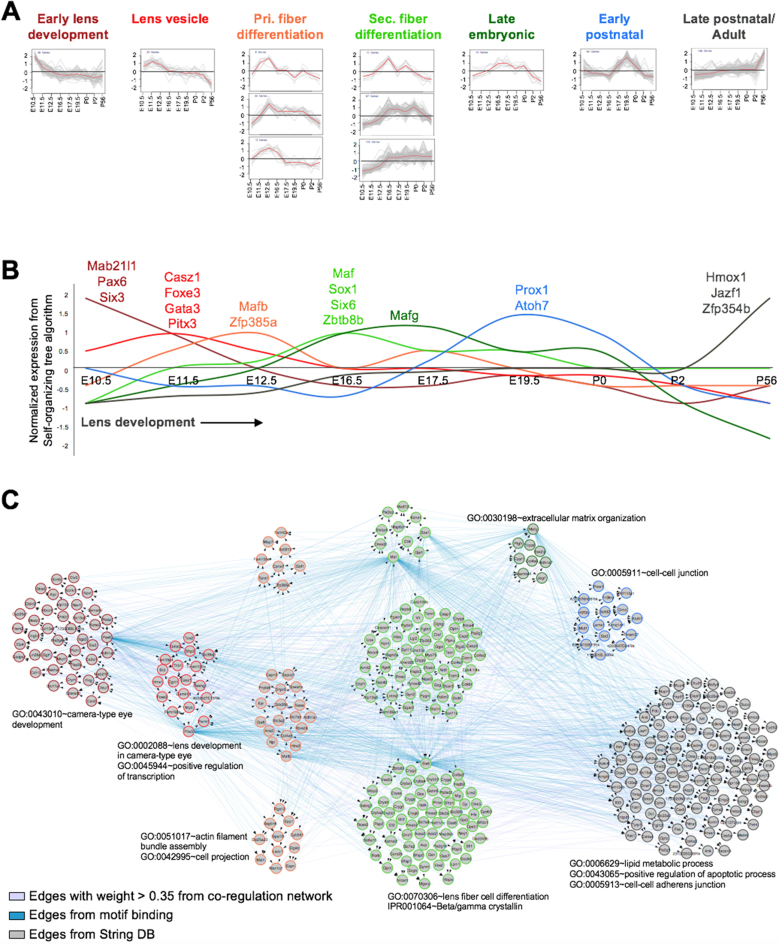
Figure 4.
iSyTE 2.0 provides insights into lens expression dynamics. (A) Expression based clustering (SOTA clustering) of the top 200 lens-enriched genes from mouse stages E10.5, E11.5, E12.5, E16.5, E19.5, P0, P2 and P56 identified eleven clusters, which are classified based on their dynamic expression patterns and peak expression stage. Clusters are plotted such that X-axis represents normalized expression in SOTA, while Y-axis shows lens development stages. The red line in each plot depicts mean expression pattern of genes in a specific cluster across different stages. (B) Combined expression dynamics of TF-genes across all eleven lens development stage clusters (‘Early lens development’ (dark red), ‘Lens vesicle’ (red), ‘Pri. fiber differentiation’ (orange), ‘Sec. fiber differentiation’ (light green), ‘Late embryonic’ (dark green), ‘Early postnatal’ (blue) and ‘Late postnatal/Adult’ (black). TFs that exhibit peak expression in each cluster are indicated. (C) A combined network of eleven cluster genes (n = 528) derived from WGCNA correlation network (purple edges), transcription factor binding motif analysis (blue edges) and String DB (gray edges) across the different developmental stages. Node border color represent specific clusters.

