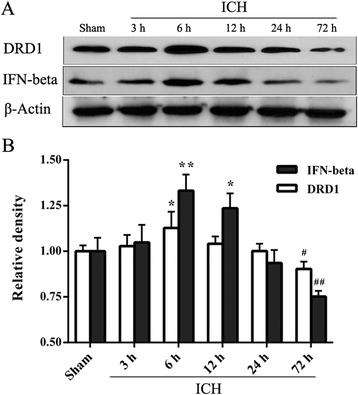
Fig. 1.

Expressions of DRD1 and IFN-beta in the ipsilateral hemispheres after intracerebral hemorrhage (ICH). a Representative photographs of DRD1 and IFN-beta in western blotting. b Bar graphs of quantitative analysis of DRD1 and IFN-beta expressions from the ipsilateral hemisphere after ICH. DRD1 and IFN-beta expressions increased, *p < 0.05, **p < 0.01 versus sham; DRD1 and IFN-beta expressions decreased, #p < 0.05, ##p < 0.01 versus sham
