
Fig. 3.
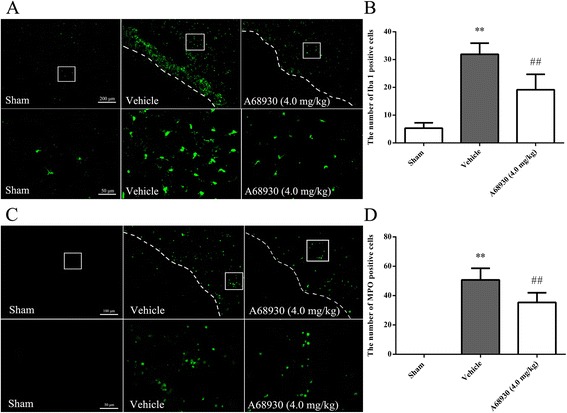
Effects of A68930 on the number of positive cells of Iba 1 or MPO after intracerebral hemorrhage (ICH). a Representative photographs of the Iba 1 positive cells in the perihematoma brain tissue. b Bar graphs of quantitative analysis of the Iba 1 positive cells in the perihematoma brain tissue. c Representative photographs of the MPO positive cells in the perihematoma brain tissue. d Bar graphs of quantitative analysis of the MPO positive cells in the perihematoma brain tissue. **p < 0.01 versus sham; ##p < 0.01 versus vehicle